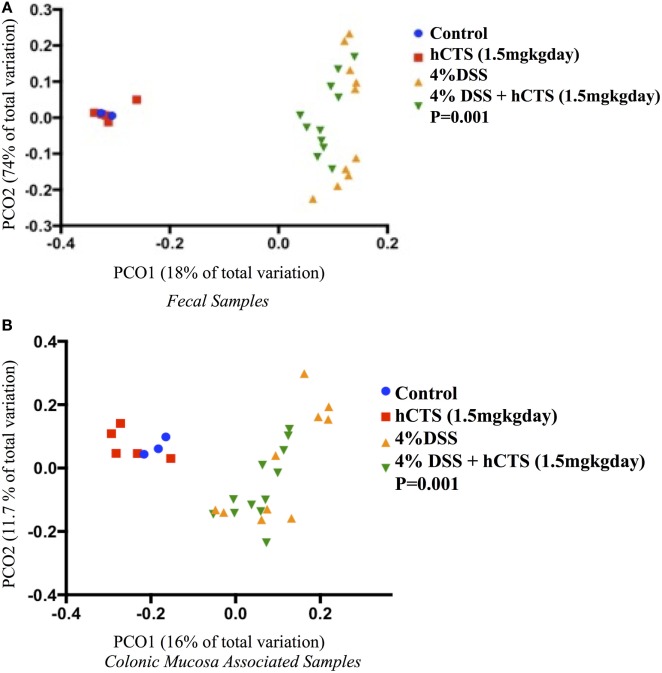
Figure 8.
Principal coordinate analysis based on the unweighted UniFrac distance metric. Fecal samples (A); Colonic mucosa-associated microbiota samples (B). Each color point represents an animal and color is shaded according to the treatment. The colitic induction clustered the microbial composition separately compared to non-colitic mice (β diversity, P-values <0.05). The human catestatin (hCTS) treatment (1.5 mg/kg/day, i.r. 7 days) did not change the microbial composition of colitic mice. P-values were calculated using permutational multivariate analysis of variance. Control (n = 2, fecal samples; n = 3, colonic mucosa-associated samples), hCTS (n = 5), 4% dextran sulfate sodium (DSS) (n = 10), 4% DSS + hCTS (n = 11, fecal samples; n = 12, colonic mucosa-associated samples).

