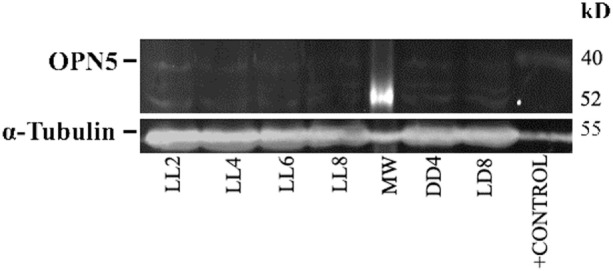
Figure 7.

Analysis of western blot of OPN5 protein expression in retina of animals exposed to light: western blot immunolabeled OPN5 with a specific antibody showing the predicted isoform bands at different times of light treatment (LL, 2, 4, 6, and 8 days) and controls in light dark and DD during 8 days. The margin shows the band corresponding to OPN5 and β-tubulin (left) and the molecular mass markers (right). Positive control: rat ear homogenate. The images are representative of three different experiments per treatment.
