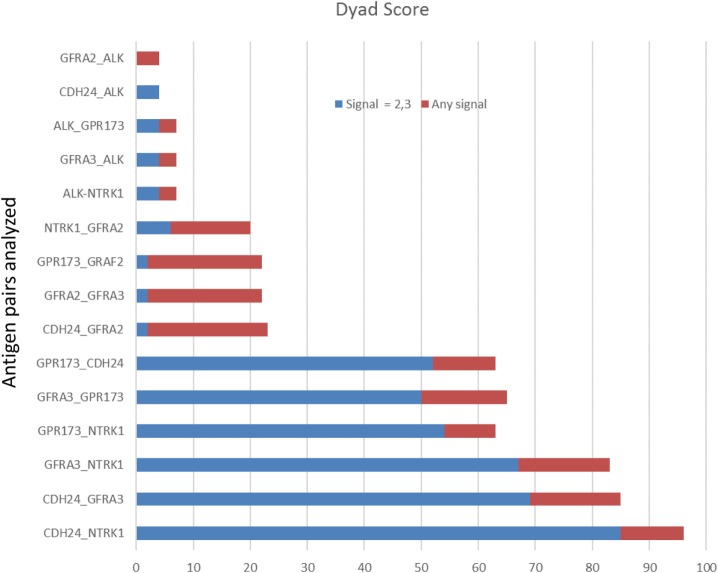
Figure 3.
Target protein expression by staining intensity. Each core of the stained tissue arrays was scored as 0, 1, 2, or 3 for target protein expression. Dyad pairs identified by bioinformatics (y-axis) were placed in a scoring matrix wherein any signal above 0 (stacked red bar) or scored a 2 or 3 (blue stacked bar) was recorded and the percentage of biopsy scores expressing both antigens across each individually stained array counted. Data are presented as a percent of total specimens (n = 54) staining positive (Dyad score).

