
Figure 2.
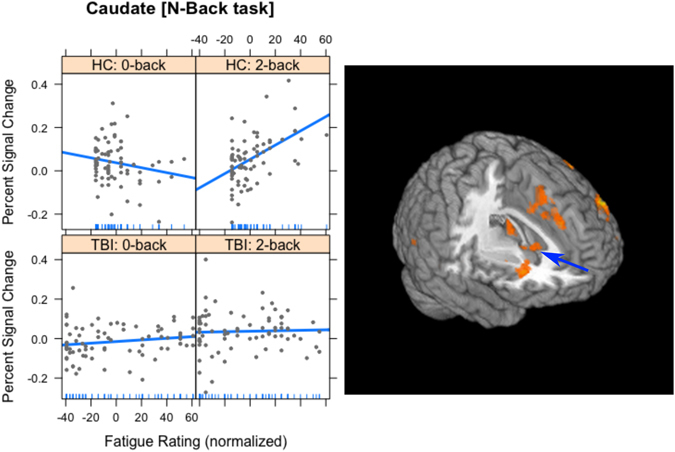
The interaction of Group, Task and Fatigue in Experiment 1 in the caudate head (indicated by blue arrow). The plots on the left are included only to show the slopes of the regression lines. For the HC group, there was a negative correlation between fatigue and activation for the 0-back task (top left), and a positive correlation for the 2-back task (top right). For the TBI group, the correlations between fatigue and activation in both tasks were very weak (lower plots). In all cases, the vertical axis is the percent signal change in the caudate head and the horizontal axis is the normalized fatigue score. On the right is a 3-dimensional rendering of the activation in the caudate head for Experiment 1.