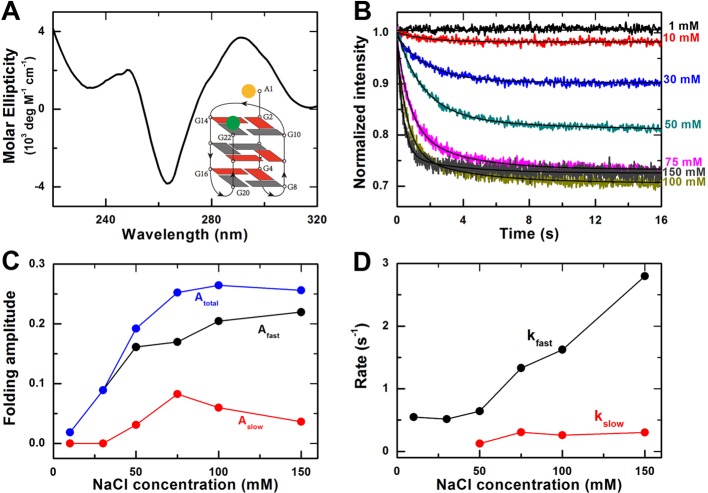
Figure 1. Effect of Na+ on G-quadruplex folding kinetics.
(A) CD spectra of G-quadruplexes in 100 mM NaCl buffer. Inset, G-quadruplex basket-type topology with fluorescent labels at the two ends of the DNA strand. (B) Time-courses of the fluorescence intensity of FAM after the unfolded G-quadruplex DNA were rapidly mixed with different concentrations of NaCl at room temperature (23°C). The solid lines are double-exponential fits of the data. (C) Folding amplitudes of the fast and the slow phases and the total amplitude obtained from the fittings in (B). (D) Folding rates of the fast and the slow phases from the fittings in (B).

