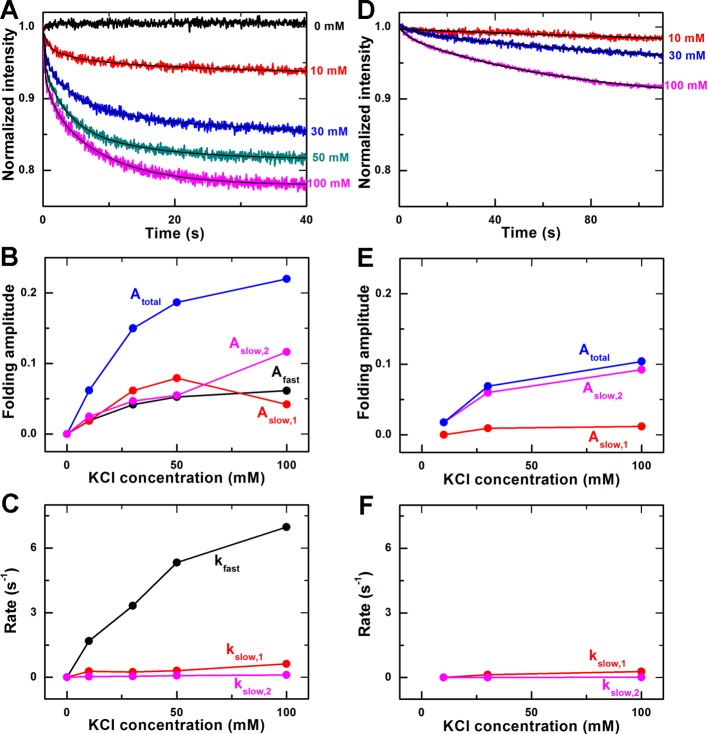
Figure 3. Transition kinetics of G-quadruplex structures from Na+ form to K+ form.
(A) Time-courses of the fluorescence intensity of FAM after the basket-type G-quadruplex, formed in the annealing buffer with 100 mM NaCl, were rapidly mixed with different concentrations of KCl at room temperature (23°C). The solid lines are triple-exponential fits of the data. (B) Folding amplitudes obtained from the fittings in (A). (C) Folding rates. (D) Time-courses measured in the same way as in (A) except for that 40% w/v polyethylene glycol-200 (PEG200) were added into the annealing buffer. The solid lines are double-exponential fits of the data. (E) Folding amplitudes in the case with PEG200. (F) Folding rates in the case with PEG200.

