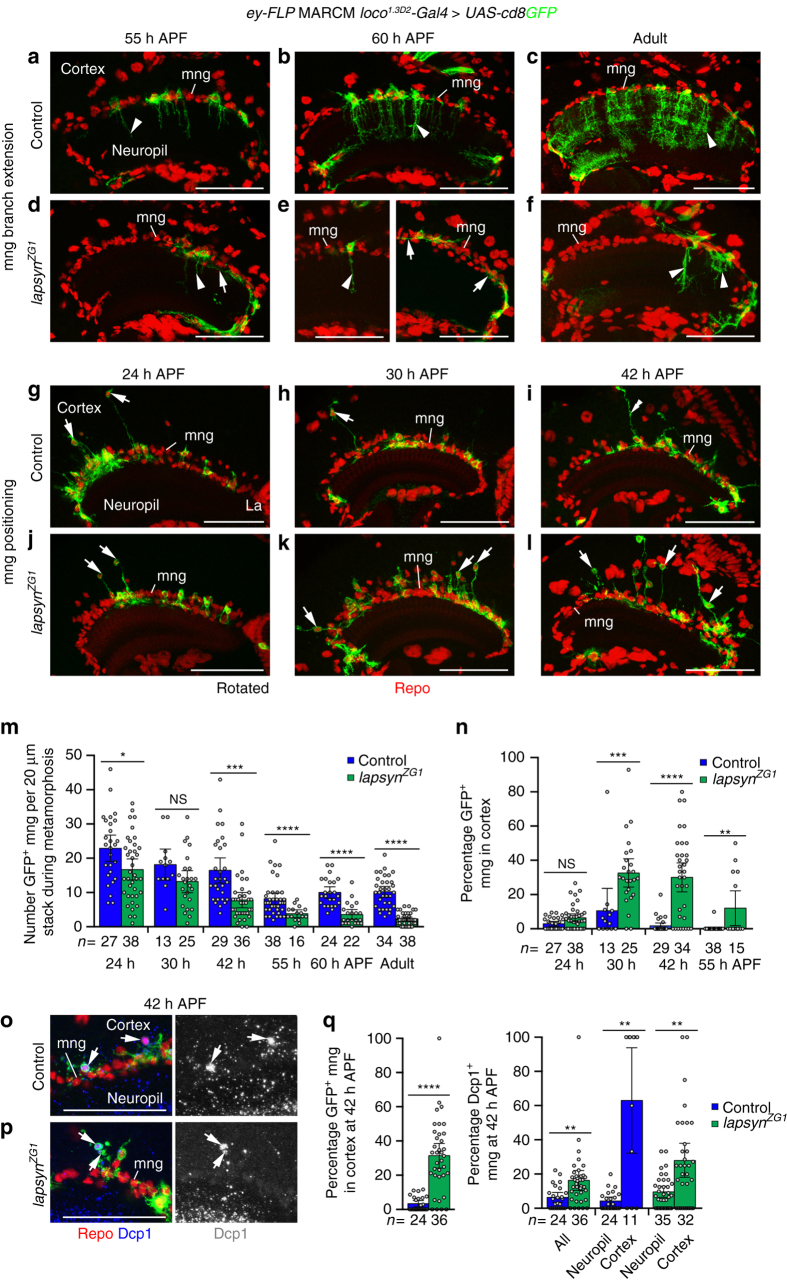
Fig. 6.
lapsyn controls astrocyte-like mng branch formation and positioning during development. Clones were generated using ey-FLP MARCM and visualized with loco 1.3D2 -Gal4 UAS-cd8GFP (green). Repo-labeled glial nuclei (red). a–f Assessment of branch formation. Unlike in controls, lapsyn ZG1 mng extended reduced branches into the neuropil (arrowheads) or ectopic branches between glial cell bodies at the neuropil border (arrows) at 55 and 60 h APF. Defects persisted in adults. g–l Assessment of positioning. Compared to controls, more lapsyn ZG1 mng cell bodies were detected in the cortex at 30 and 42 h than at 24 h APF (arrows). These sent long protrusions to the neuropil border. mng at the border extended long processes into the cortex (i, double arrowhead). Quantifications assessing numbers of GFP-positive mng (m) and percentages in the cortex of control and lapsyn ZG1 mosaics (n) during metamorphosis. Scatter plots with bars show data points and means ± 95% confidence intervals (n = 20-μm stacks of optical sections from 19,27,6,12,18,21,22,12,13,13,19, and 23 (m) and 19, 27, 6, 12, 18, 19, 22, and 12 optic lobes (n). m Unpaired, two-tailed Student’s t-test not assuming equal variance: P = 0.0129, P = 0.0678, P = 0.0001, P = 5.47 × 10⁻⁵, P = 4.38 × 10⁻⁷, P = 2.03 × 10⁻¹². n Two-tailed Mann-Whitney U-test corrected for ties: P = 0.0557, P = 0.0002, P = 4.0 × 10⁻⁷, P = 0.0010. o, p Dcp1 (blue) labeling reveals that control (o) and lapsyn ZG1 (p) mng in the cortex undergo apoptosis (arrows) at 42 h APF. q Comparison of percentages of control and lapsyn ZG1 clones in the cortex (left) and Dcp1-positive clones in the cortex and at the neuropil border (right) at 42 h APF. Scatter plots with bars show data points and means ± 95% confidence intervals (n = 20-μm stacks from 21, 29 (left), 21, 29, 21, 11, 28, and 26 optic lobes). Two-tailed Mann-Whitney U-test corrected for ties: P = 2.4 × 10⁻⁷, P = 0.0016, P = 0.0029, P = 0.0025. NS not significant, *P < 0.05, **P < 0.01, ***P < 0.001, ****P < 0.0001. Panels a–l show projections. For genotypes, sample numbers and additional statistical values, see Supplementary Tables 1 and 2. Scale bars, 50 μm

