
Fig. 8.
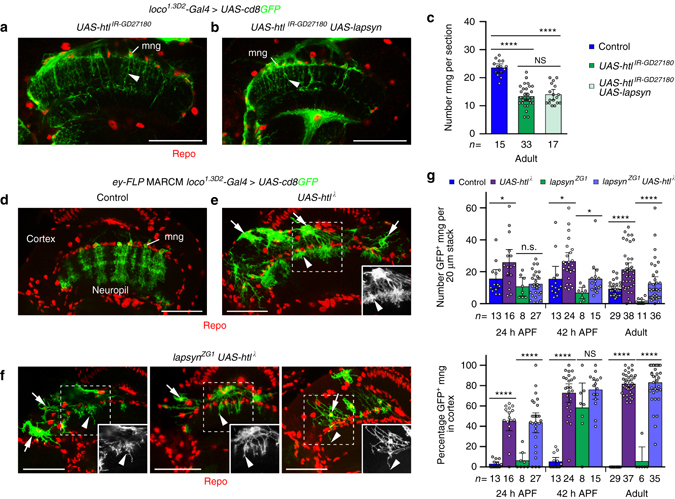
lapsyn does not directly mediate survival of astrocyte-like mng. Repo-stained glial nuclei (red). a, b mng were labeled with loco 1.3D2 -Gal4 UAS-cd8GFP (green). htl knockdown with UAS-htl IR-GD27180 disrupted mng branch morphogenesis in adults (a, arrowhead). UAS-lapsyn expression did not rescue these defects (b, arrowhead). c Quantification of mng numbers. UAS-lapsyn expression did not rescue the decrease of cell numbers following htl knockdown. The scatter plot with bars shows data points and means ± 95% confidence intervals (n = optic lobes (one optical section)). Unpaired, two-tailed Student’s t-test not assuming equal variance: P = 9.84 × 10⁻¹³, P = 1.82 × 10⁻⁹, P = 0.5166. d–f UAS-htl λ was expressed in mng clones using ey-FLP MARCM and loco 1.3D2 -Gal4 UAS-cd8GFP. Unlike in controls (d), wild-type clones (e), and lapsyn ZG1 mutant clones (f) expressing UAS-htl λ migrated into the medulla cortex and survived until adulthood (arrows). UAS-htl λ expressing clones extended short bushy processes into the neuropil (e, arrowhead). In lapsyn ZG1 mng clones expressing UAS-htl (f), branching is reduced in the cortex (arrow) and neuropil (arrowheads). g Quantification of ey-FLP MARCM clone numbers and localization at 24 and 42 h APF, and in adults. UAS-htl λ expression increased the number of glial cell clones compared to wild type and promoted lapsyn ZG1 clone survival. High percentages of wild type and lapsyn ZG1 clones overexpressing UAS-htl λ were found in the medulla cortex. Scatter plots with bars show data points and means ± 95% confidence intervals. Unpaired, two-tailed Student’s t-test not assuming equal variance: P = 0.0396, P = 0.5881, P = 0.0241, P = 0.0144, P = 2.49 × 10⁻⁶, P = 1.04 × 10⁻⁵ (top: n = 20-μm stacks of optical sections from 4,7,2,9,6,10,3,6,14,16,4 and 14 optic lobes); P = 4.25 × 10⁻⁸, P = 2.92 × 10⁻⁷, P = 7.97 × 10⁻¹⁵, P = 0.1432, P = 2.11 × 10⁻³⁴, P = 6.59 × 10⁻²² (bottom: n = 20-μm stacks from 4,7,2,9,6,10,3,6,14,15,4 and 14 optic lobes). NS, not significant, *P < 0.05, ****P < 0.0001. All image panels show projections. For genotypes, sample numbers and additional statistical values, see Supplementary Tables 1 and 2. Scale bars, 50 μm