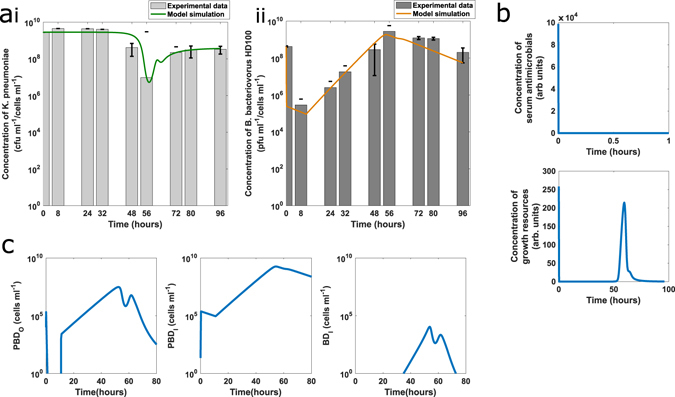
Figure 6.

Model simulations of predation in human serum in comparison to experimental data, validating parameters estimated. (a) Model simulations with the best fit parameters (given in Supplementary Table S2) give a good fit to experimental data (mean of experimental repeats 1 and 2 from Fig. 5), with comparable dynamics. The drop in prey concentration due to predation and corresponding rise in predator numbers seen in the experimental data is replicated in the numerical simulation (b) The predators attached to prey (PBDO), predators inside prey i.e. bdelloplast (PBDI) and inactivated predators (BDI) are shown plotted against time. All three plots show a halting of predation for the first approximately 15 hours, then a continuing of the predatory cycle. By around 56 hours all the prey have become resistant. (c) The simulated serum antimicrobial concentrations showed that the antimicrobial activity of the serum is used up quickly (within the first 10 minutes of the simulation). Initial serum growth resources in the simulation are also quickly depleted, but an increase in growth resources is seen after 50 hours as lysis of bdelloplasts starts to release nutrients into the system.
