Figure 3.
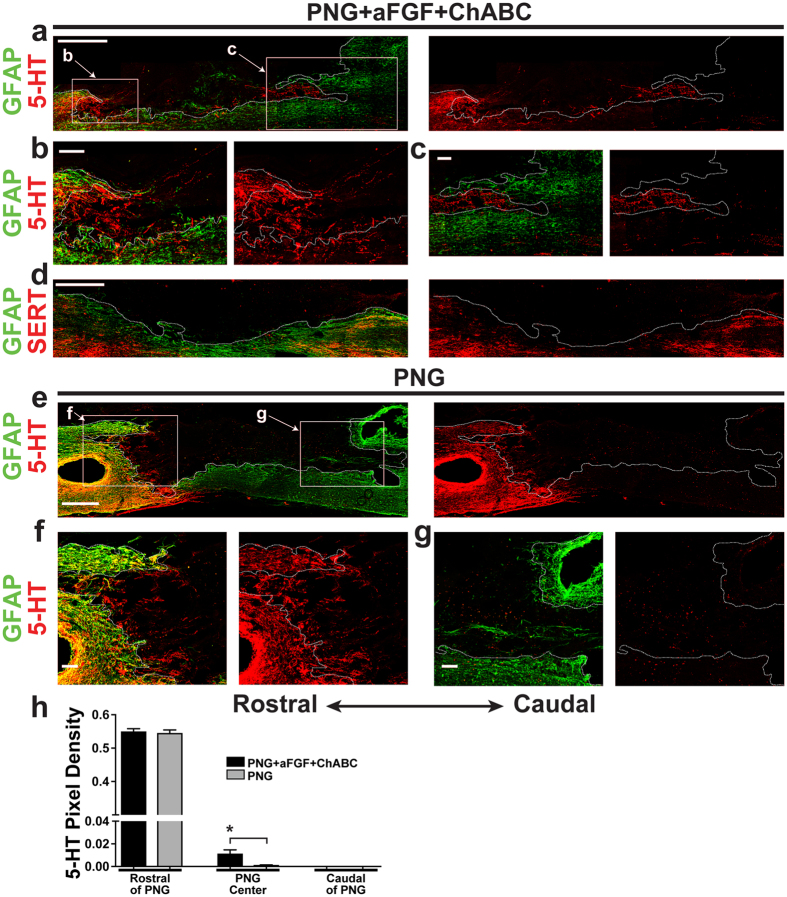
5-HT+ nerve fibers fail to regenerate in the chronically repaired cord. (a–d) Images are from PNG+aFGF+ChABC-treated animals. The dotted line in each panel delineates the interface between the graft and spinal cord. (a) A representative low-magnification confocal image of a sagittal section with GFAP labeling (green) and 5-HT staining (red) displaying the overall anatomy of the PNG, spinal cord, and regenerating 5-HT+ axons. Scale bar, 500 µm. (b) High-magnification confocal image of the rostral cord/PNG interface boxed in a. Note the small density of 5-HT+ stained axons (red) entering the PNG (GFAP-negative area) from the rostral end of the spinal cord (green). Scale bar, 100 µm. (c) High-magnification confocal image of the caudal PNG/cord interface boxed in a. Few 5-HT+ stained axons (red) reach the distal end of the graft, and no 5-HT axons exit the graft back into the caudal spinal cord (green). Scale bar, 100 µm. (d) Low-magnification confocal image of a sagittal section with GFAP labeling (green) and SERT staining (red) displaying the overall anatomy of the PNG, spinal cord, and lack of regenerating SERT+ axons. Scale bar, 500 µm. (e–g) Images are from PNG-treated animals. The dotted line in each panel delineates the interface between the graft and spinal cord. (e) A representative low-magnification confocal image of a sagittal section with GFAP labeling (green) and 5-HT staining (red) displaying the overall anatomy of the PNG, spinal cord, and regenerating 5-HT+ axons. Scale bar, 500 µm. (f) High-magnification confocal image of the rostral cord/PNG interface boxed in e. Note sparse 5-HT+ stained axons (red) entering the PNG (GFAP-negative area) from the rostral end of the spinal cord (green). Scale bar, 100 µm. (g) High-magnification confocal image of the caudal PNG/cord interface boxed in e. Note that no 5-HT+ stained axons (red) reach the distal end of the graft and no 5-HT+ axons exit the graft back into the caudal spinal cord (green). Scale bar, 100 µm. (h) Quantification of the density of 5-HT-immunoreactive fibers found in the rostral spinal cord adjacent to the PNG, in the center of the PNG, and in the caudal spinal cord adjacent to the distal PNG. n = 6 per group. *p < 0.05, Student’s t-test. Data represent mean ± S.E.M.

