
Figure 8.
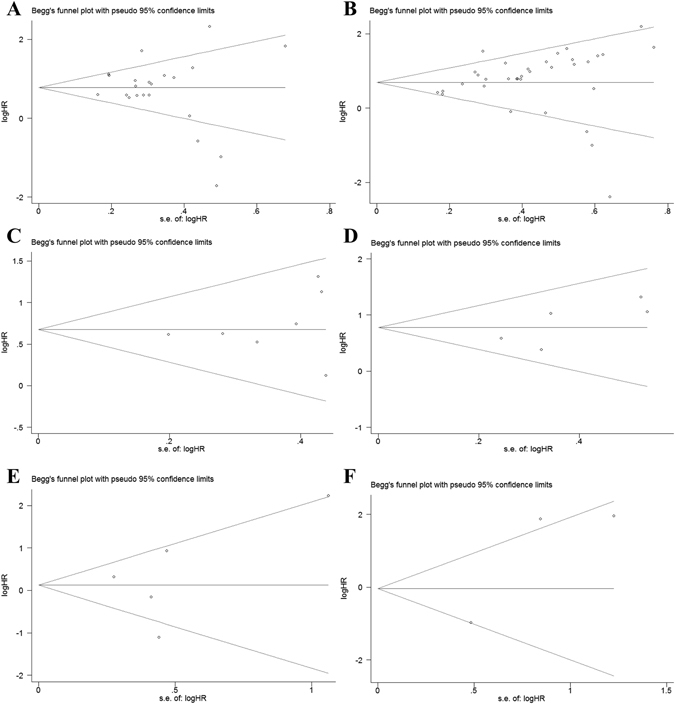
Begg’s funnel plot for publication bias test. (A) OS of high-expression of miR-17-92 cluster in various tumors under univariate analysis; (B) OS of high-expression of miR-17-92 cluster in various tumors under multivariate analysis; (C) DFS of high-expression of miR-17-92 cluster in various tumors under univariate analysis; (D) DFS of high-expression of miR-17-92 cluster in various tumors under multivariate analysis; (E) RFS of high-expression of miR-17-92 cluster in various tumors under univariate analysis; (F) RFS of high-expression of miR-17-92 cluster in various tumors under multivariate analysis;). The x-axis is log (HR), and the y-axis is natural logarithm of HR. The horizontal line in the figure represents the overall estimated log (HR). The two diagonal lines indicate the pseudo 95% confidence limits of the effect estimate. Log (HR) = log-transformed HR, HR = hazard ratio.