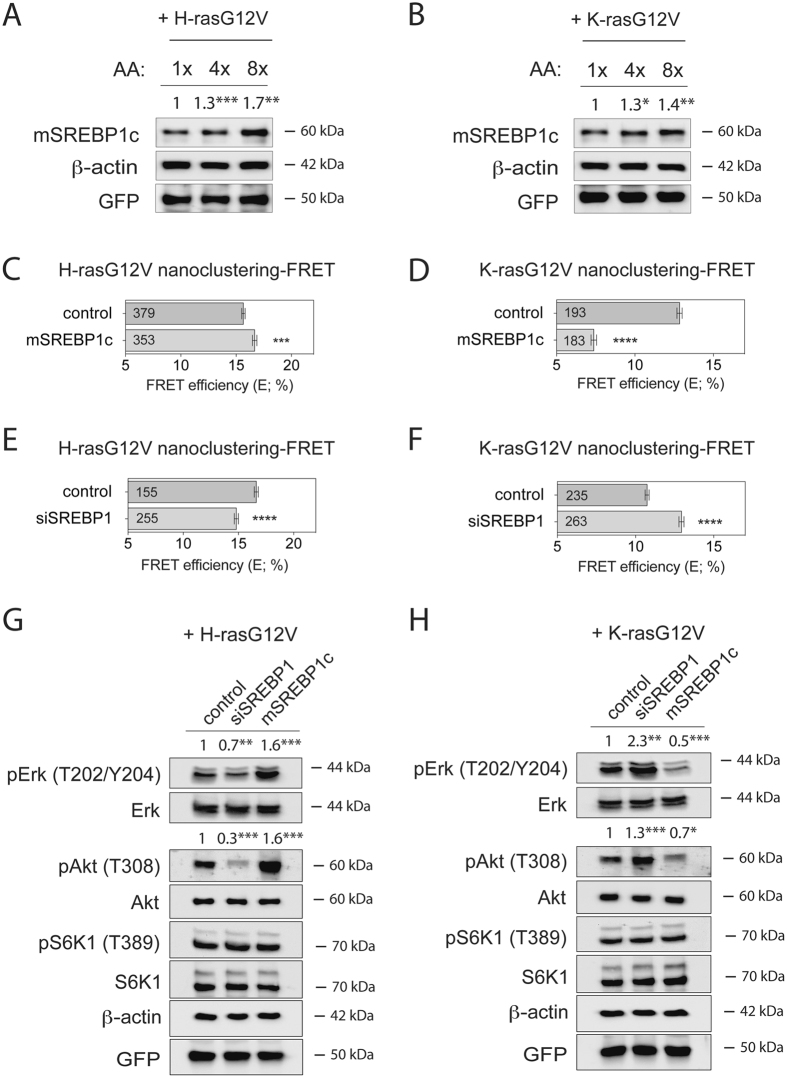
Figure 5.
mSREBP1c inversely regulate signalling output driven by oncogenic H-ras or K-ras. (A,B) Western blot analysis of mSREBP1c in HEK cells transiently expressing (A) mGFP-H-rasG12V or (B) mGFP-K-rasG12V. Cells were incubated for 24 h with increasing concentrations of amino acids (1x, 4x or 8x) in the absence of serum. Numbers indicate β-actin normalized mSREBP1 levels (n = 3). (C,D) Nanoclustering-FRET analysis in HEK cells transfected with mature Flag-tagged mSREBP1c or empty vector, co-expressing mGFP- and mCherry-tagged (C) H-rasG12V or (D) K-rasG12V. The numbers in the bars indicate the number of analyzed cells (mean ± SEM, n = 4). (E,F) Nanoclustering-FRET analysis in HEK cells transfected with scrambled siRNA or siRNA directed to SREBP1, and co-expressing mGFP- and mCherry-tagged (E) H-rasG12V or (F) K-rasG12V. The numbers in the bars indicate the number of analyzed cells (mean ± SEM, n = 4). Note that the variations in FRET efficiency (%) of the control levels in C, E and D, F are due to the different experimental procedures. (G,H) Western blot analysis of Ras- and mTORC1-signalling in HEK cells transfected with siRNA SREBP1 or Flag-tagged mSREBP1c vector, transiently expressing (G) mGFP-H-rasG12V or (H) mGFP-K-rasG12V. Numbers indicate the ratio of phosphorylated to respective total protein levels (n = 3). Statistical significance levels are annotated as *p < 0.05; **p < 0.01; ***p < 0.001; ****p < 0.0001.

