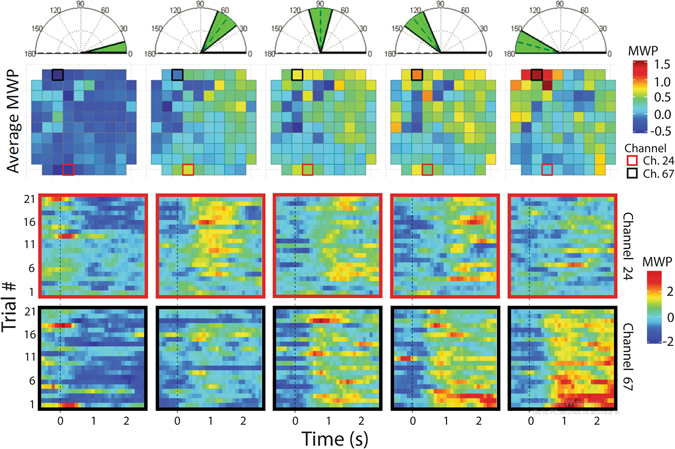
Figure 2.

Imagined graded muscle contractions modulates neural activity in M1. The top row shows the angle cue that was presented visually to the participant. Each column corresponds to the cue from the top row. The second row shows the mean MWP superimposed on the layout of the MEA. The MWP is averaged over each trial from 0.5 s after cue presentation to 2.5 s after cue presentation. The third row shows the temporal evolution of MWP for each of the 21 trials (for the rest cues we show the first 21 trials) for Channel 24 from 0.5 s before the cue until 2.5 s after the cue. The dashed line at 0 s represents the time of cue presentation. Channel 24 shows a pattern of low MWP for the rest angle, high MWP activity at the lower non-zero angles and decreasing MWP activity as the angles increase. The last row follows the same format as above but represents Channel 67, which shows increasing MWP activity with increased angles.
