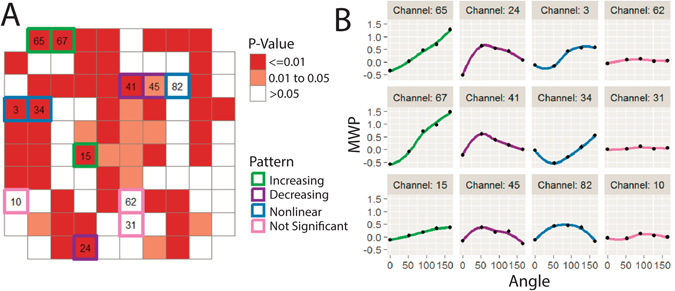
Figure 3.

Neural modulation patterns with imagined graded muscle contractions. (A) The p-values from the beta regression are overlaid over the physical layout of the microelectrode array (MEA). Selected individual channels (highlighted in A) demonstrate a range of neural modulation trends in response to the cued angles. (B) Each column shows selected individual channels where the average MWP (1) increased with increasing cue angles (green), (2) decreased with increasing non-zero cue angles (purple), (3) showed a non-linear relationship with cue angle (blue) and (4) did not show significant response to the cue angles (pink). The average MWP values are calculated the same as in Fig. 2.
