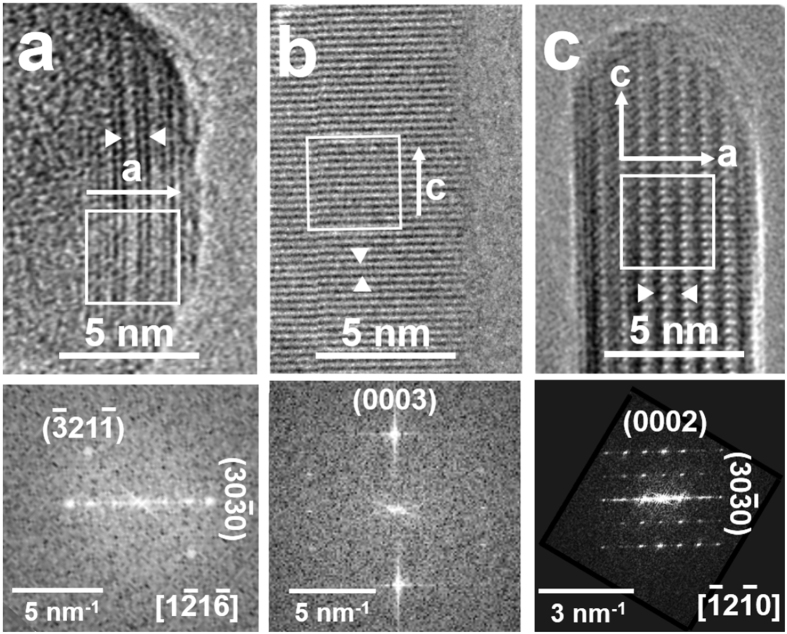
Figure 2.
HR-TEM images of border regions of (a) Cit-HA-4 h, (b) Cit-HA-24 h and (c) Cit-HA-96 h. Interfringes spaces within the arrows are 0.814 nm in a and c, corresponding to = 0.8154 nm, and 0.229 nm in b, corresponding to d{0003}= 0.2294 nm. Original magnification: 400k ×. Insets: FT of the image portions enframed within the white squares. As indicated in the insets, particles were observed along the following directions (zone axes): (a) (a-axis in the image plane, c-axis forming an angle of ∼55° below the image plane); (c) , i.e. the b-axis (c-axis in the image plane, a-axis forming an angle of 30° below the image plane).

