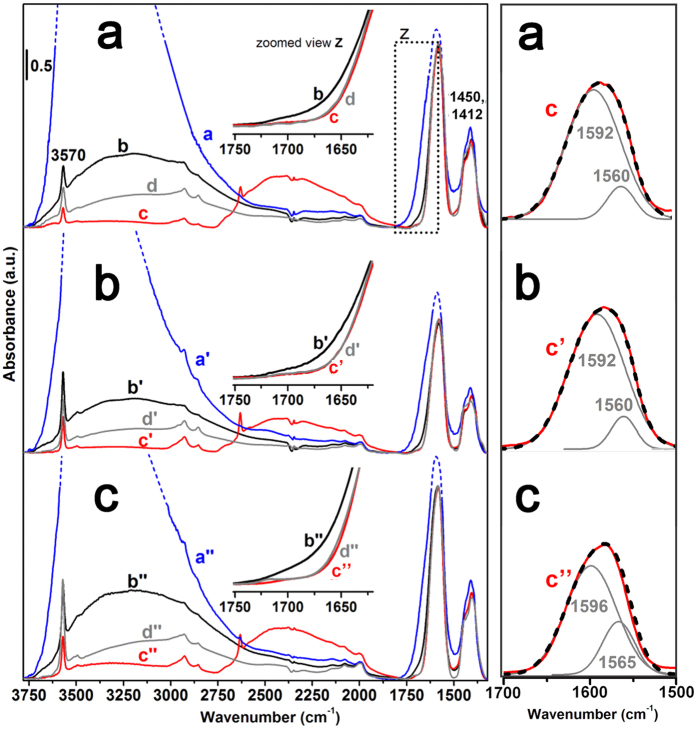
Figure 3.
IR spectra of (a) Cit–HA–4 h, (b) Cit–HA–24 h; (c) Cit–HA–96 h. Left panel, curve labelling in left panel is: (a,a’,a”) in contact with H2O vapor at 20 mbar; (b,b’,b”) after 60 min outgassing at b.t.; (c,c’,c”) after exchange with D2O and subsequent 60 min outgassing at b.t.; (d,d,’d”) after back exchange with H2O and subsequent 120 min outgassing at 433 K. Inset: zoomed view of the 1750–1600 cm−1 range. Right panel: zoomed view of the 1700–1500 cm−1 range, showing the experimental νCOO− asym band in curves c,c’,c” (thus without any δH2O contribution) and related fitting (dashed black curve = sum of individual components, in grey).

