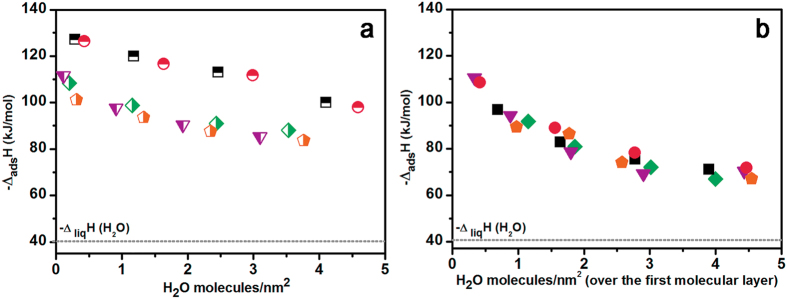
Figure 4.
Enthalpy of adsorption versus uptake of H2O molecules on: red symbols = HA1; black symbols = HA2; orange symbols = Cit–HA–4 h; purple symbols = Cit–HA–24 h and green symbols = Cit–HA–96 h. Panel a, half-filled symbols: attainment of the first hydration layer. Panel b, full symbols: additional adsorption of water, within the limit of the method. Related volumetric isotherms (adsorbed H2O molecules·nm2 vs. pH2O) are in Supplementary Fig. S5. The dotted line indicated the value of latent enthalpy of liquefaction of water, −ΔliqH(H2O), for the sake of comparison.

