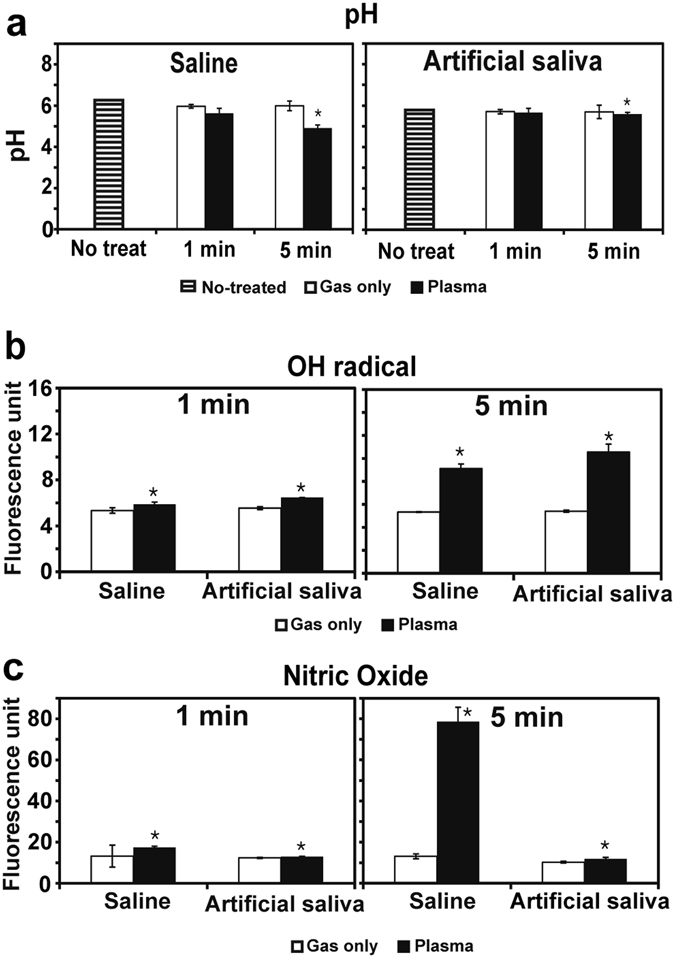
Figure 4.

Changes in pH, OH radical level, and NO level in saline or artificial saliva after plasma treatment for 1 min or 5 min. (a) pH of saline and artificial saliva after gas or plasma treatment. (b) OH radical level in saline and artificial saliva after gas or plasma treatment. (c) Levels of NO species in saline and artificial saliva after gas or plasma treatment. Levels of OH radical and NO are indicated by fluorescence intensity of terephthalic acid (TA) and 4-Amino-5-Methylamino-2′,7′-Difluorofluorescein combined with OH radical and NO, respectively. All values are means ± standard deviations of nine measurements. *P < 0.05.
