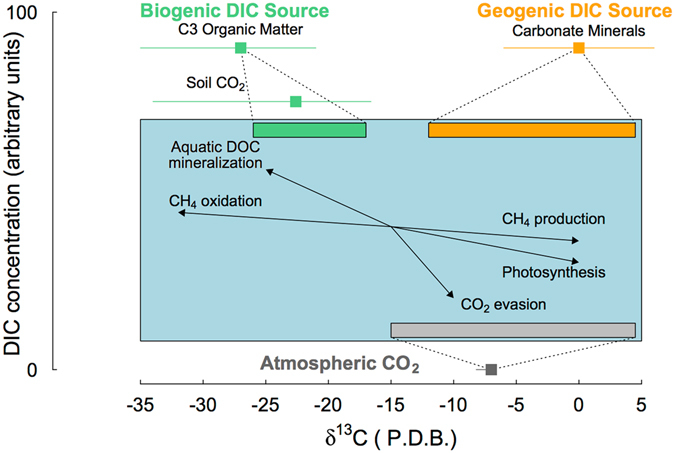
Figure 1.

Conceptual scheme illustrating biogeochemical processes controlling stream δ13C-DIC values in streams, adapted from Amiotte-Suchet et al.41 and Alling et al.75. The x-axis represents the reported range of stream δ13C-DIC values and y-axis a gradient in DIC concentration with arbitrary units. The internationally agreed δ13C end-members for the biogenic (−27‰) DIC source in a C3 catchment (green square) and geogenic (0‰) DIC source (orange) as well as the atmospheric CO2 (−8.5‰) are represented with their documented range (coloured bars) from Coplen et al.78. The blue box represents the stream water environment, with the commonly accepted range of δ13C-DIC values in equilibrium with each of these three end-members (Biogenic (−26 to −18‰), Geogenic (−12‰ to 5‰), Atmospheric (−15% to 8‰), represented in coloured rectangles, along with the isotopic effect of in-stream biogeochemical processes represented as the black arrows.
