Figure 5.

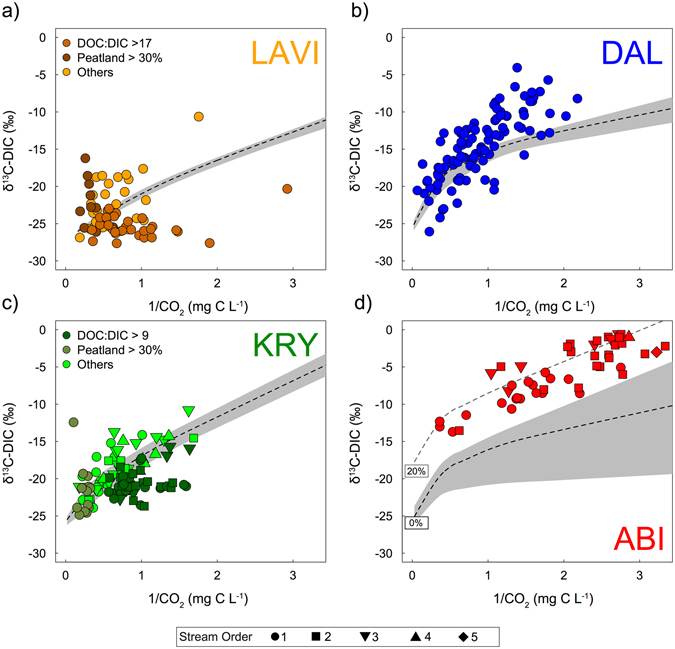
Scatterplots showing the relationship between δ13C-DIC and the inverted CO2 concentration [1/CO2], comparing stream observations with modelled trajectories of δ13C-DIC evolution with CO2 evasion for the streams in (a) LAVI, (b) DAL, (c) KRY and d) ABI39. The mean modelled trajectories are represented as the black dotted line with the grey area illustrating the upper and lower prediction boundaries. Each point represents a different stream observation. In the case of (a,c) certain streams were also coloured to identify streams with DOC:DIC ratios above the regional average, and peatland cover >30%. In the case of (c,d) different symbols were attributed to the Strahler stream order (1–5). In (d), additional curves represent the shift in modelled CO2 evasion with 20%, contribution of geogenic DIC source (initial δ13C-DIC value = −20‰).
