
Figure 1.
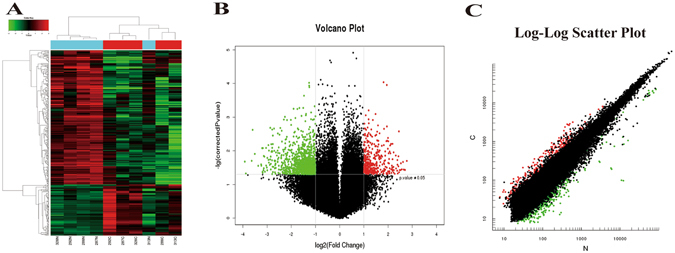
Hierarchical clustering, volcano plots, and scatter plots exhibited the differentially expressed circRNAs in gastric cancer tissues compared to paired non-gastric cancer tissues. (A) Hierarchical clustering, numbers were the samples used for the microarray assay. C: cancer tissues, N: non-cancerous tissues. (B) Differentially expressed circRNAs were displayed by volcano plots. The green and red parts indicated >2 fold-decreased and -increased expression of the dysregulated circRNAs in GC tissues, respectively (p < 0.05). (C) Differentially expressed circRNAs were displayed by scatter plots. The green and red parts indicated >2 fold-decreased and -increased expression of the dysregulated circRNAs in GC tissues (p < 0.05).