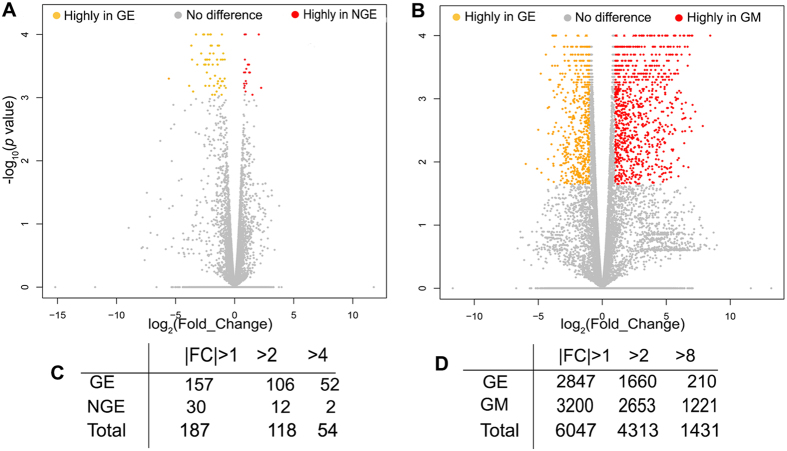
Figure 2.
Volcano plots (A,B) and number of highly expressed DEGs at different fold changes (FC) (C,D) to display the DEGs in the GE vs NGE (A,C) and GE vs GM (B,D) in the base of oral cavity of P3 male chickens. In A and B, the Y-axis corresponds to the mean expression value of log10 (p-Value), and the X-axis displays the log2 (Fold_Change). The orange and red dots represent highly expressed genes in the GE (A,B) or NGE (A) or GM (B) (p < 0.05, FDR q < 0.05); the gray dots represent the transcripts whose difference of expression levels did not reach statistical significance (p > 0.05, FDR q > 0.05). GE: gustatory epithelium; NGE: non-gustatory epithelium; GM: gustatory mesenchyme.

