
Figure 7.
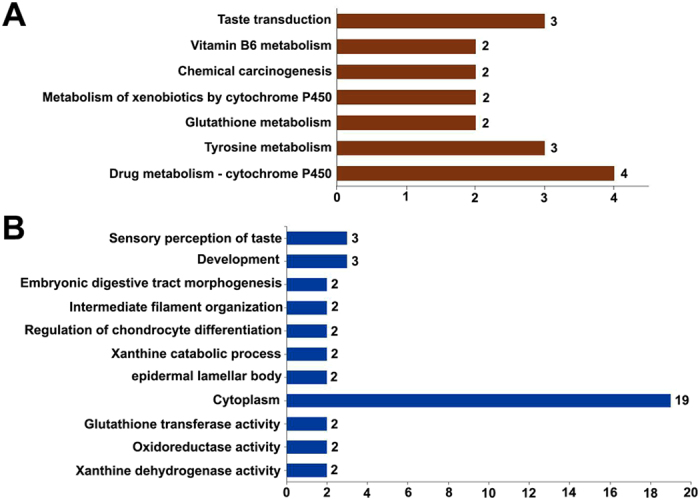
Histogram presentation of the number of shared DEGs belonging to significant pathways (A) and selected gene ontology (GO) terms (B). The shared DEGs were detected by comparisons of both GE vs NGE and GE vs GM of the base of oral cavity.
Official websites use .gov
A
.gov website belongs to an official
government organization in the United States.
Secure .gov websites use HTTPS
A lock (
) or https:// means you've safely
connected to the .gov website. Share sensitive
information only on official, secure websites.
Histogram presentation of the number of shared DEGs belonging to significant pathways (A) and selected gene ontology (GO) terms (B). The shared DEGs were detected by comparisons of both GE vs NGE and GE vs GM of the base of oral cavity.