
Figure 5.
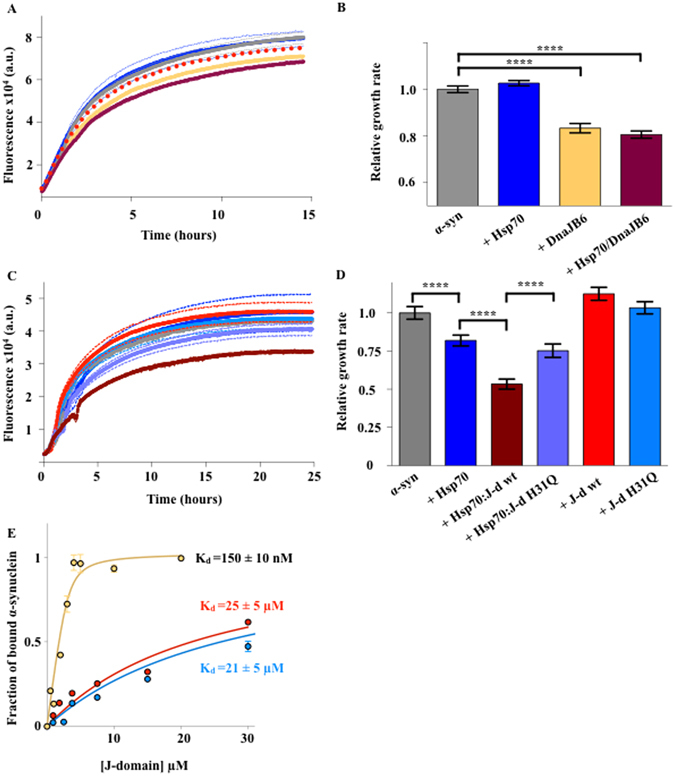
Effect of DNAJB6 on the aggregation of α-syn. (A) Seeded aggregations of α-syn alone (grey) or in the presence of either 0.5 µM Hsp70 (blue), 0.15 µM DNAJB6 (yellow), or 0.4 µM Hsp70 and 0.1µM DNAJB6 (maroon). Individual values are the mean of four independent experiments. The red dashed line is the sum of the concentration-corrected effects derived from the blue and yellow lines, which corresponds to the theoretical aggregation profile in the presence of 0.4 µM Hsp70 and 0.1 µM DnaJB6 if their effect was simply additive. (B) Bar plot of the initial velocities of the aggregation reactions in (A) normalised on the value of α-syn alone. (C) ThT aggregation experiments in seeding conditions of α-syn in the absence (grey) or in the presence of either 0.5 µM Hsp70 (blue), wt J-domain (red), H31Q J-domain (cyan), Hsp70:wt J-domain (maroon) or Hsp70:H31Q J-domain (violet). (D) Bar plot representing the initial growth rates of aggregation from panel (C) normalised on the value of α-syn alone. (E) Fluorescence binding assay of DnaJB6 (yellow), wt J-domain (red), or H31Q J-domain (cyan), to Alexa488-α-synuclein. The apparent Kds of binding are reported on the side of each curve. Statistical analysis was performed by one-way ANOVA with post-multiple comparison (99% CI, *P ≤ 0.05, **P ≤ 0.01, ***P ≤ 0.001, ****P ≤ 0.0001).