
Figure 6.
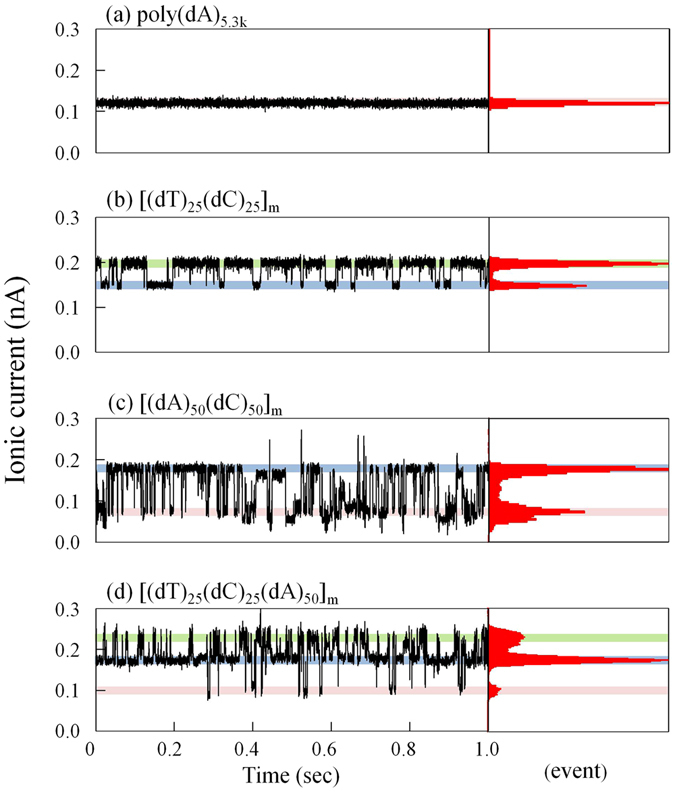
Short-term time trace of the ionic current while the homopolymer or block copolymer remained in the nanopore. Typical time trace of the ionic current for 1 sec while (a) poly(dA)5.3k, (b) [(dT)25-(dC)25]m, (c) [(dA)50-(dC)50]m, and (d) [(dT)25-(dC)25-(dA)50]m remained in the nanopore. Each applied voltage was 100 mV. Each current signal was filtered at 2 kHz. The values of the ionic-current blockades at the intensity peaks in each histogram were (a) 118 pA; (b) 148 pA and 197 pA (shaded blue and green, respectively); (c) 72 pA and 176 pA (shaded red and blue, respectively); and (d) 98 pA, 173 pA, and 222 pA (shaded red, blue and green, respectively).