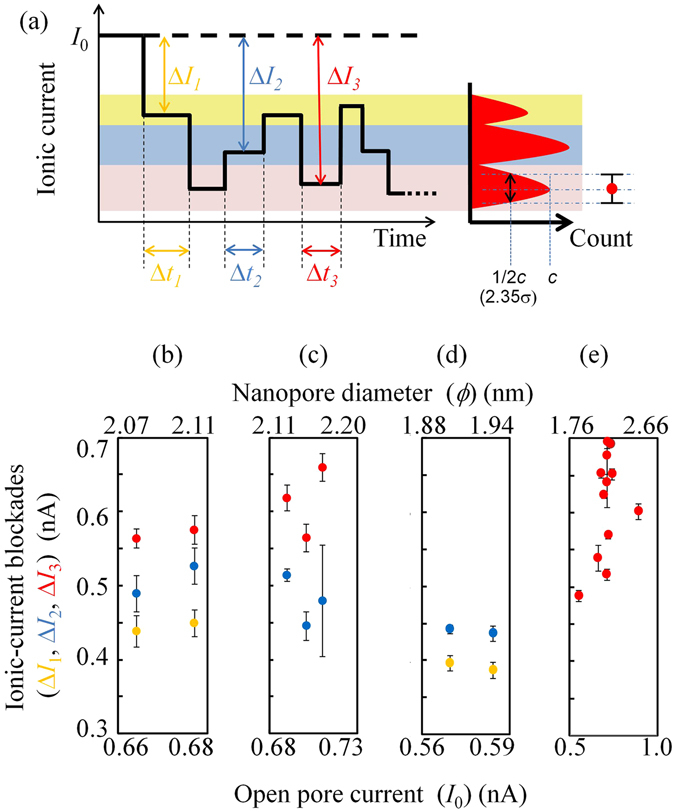
Figure 7.

Relationship between the open pore current and ΔI. (a) Schematic of the time trace of the ionic current while DNA remained in the nanopore. ΔI 1 < ΔI 2 < ΔI 3 are represented in orange, blue and red, respectively. (b) Data for when [(dT)25-(dC)25-(dA)50]m remained in the nanopore. (c) Data for when [(dA)50-(dC)50]m remained in the nanopore. (d) Data for when [(dT)25-(dC)25]m remained in the nanopore. (e) Data for when poly(dA)5.3k remained in the nanopore.
