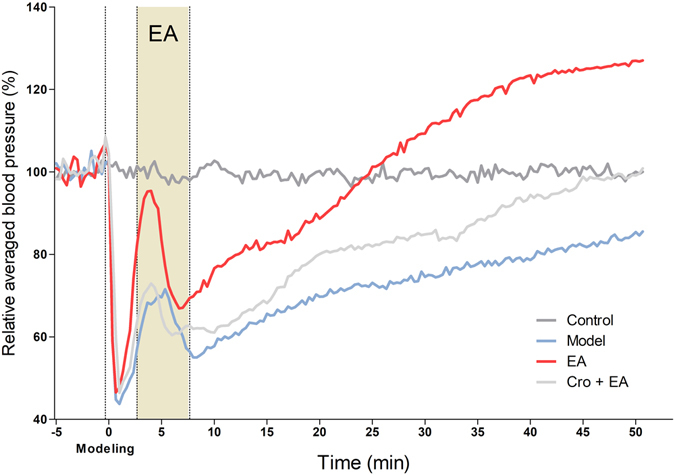
Figure 6.

Relative blood pressures among different groups (n = 5–6). Blood pressure was measured at the left carotid artery. The average of 50 beats was calculated for every 20 s. The average relative blood pressures of each group are shown with different colours. An intravenous injection of pituitrin was applied to induce bradycardia 5 min after recording, indicated as “Modelling” with a dashed line. EA was applied at PC 6 at 3 min after modelling (shadow area).
