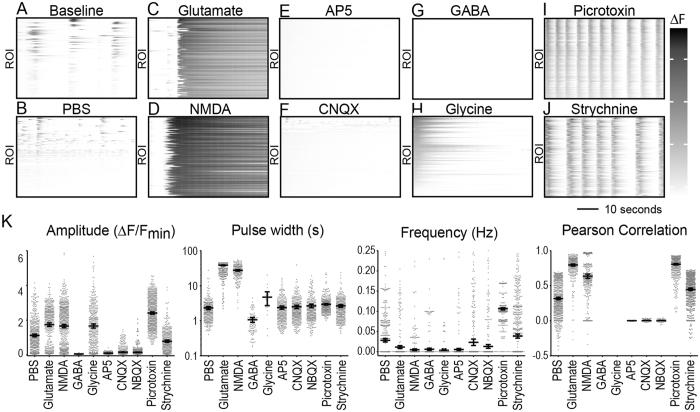
Figure 4.
Waveform perturbation by receptor agonists and antagonists. (A) DIV11 cortical neurons were (A) left untreated or acutely treated with (B) PBS, (C) glutamate (23 μM), (D) NMDA (35 μM), (E) AP5 (29 μM), (F) CNQX (3 μM), (G) GABA (27 μM), (H) glycine (1.7 mM), (I) picrotoxin (2.4 μM), or (J) strychnine (6.3 μM). Representative raster plots show Δ fluorescence traces for each ROI within the optical field. Data are representative of 3–6 treatment replicates across two independent experiments. (K) Average amplitude, frequency, pulse width, and Pearson correlation coefficient are plotted. Error bars represent 95% CI.

