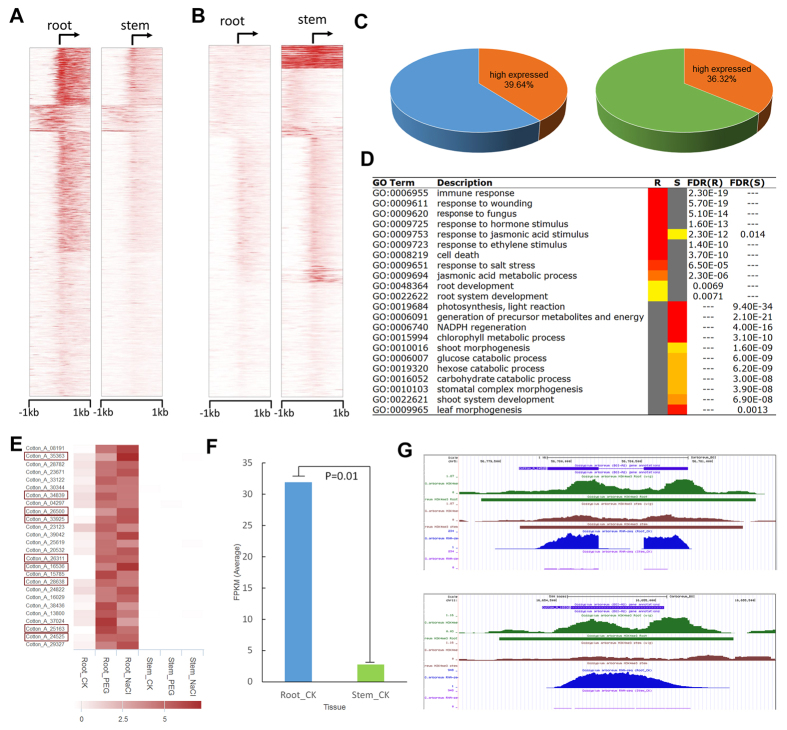
Figure 10.
Modularized comparison of differential histone modification during development. Heatmaps for H3K4me3 around the TSSs of 4,871 root-up modification (A) and 1,608 stem-up modification (B) genes in G. arboreum. K-means were used to cluster them into four groups. For each gene, the histone modification intensities are displayed along –1-kb to 1-kb regions around the TSSs. The colour represents H3K4me3 levels. (C) 39.64% of the 4,871 root-up modification genes are highly expressed in root (left) and 36.32% of the 1,608 stem-up modification genes are highly expressed in stem (right). (D) GO enrichment results for genes having both high H3K4me3 modification and expression in root (R) and stem (S) are selected here. The red and grey boxes with “GO: 0006955” stand for root-up genes that are enriched significantly, whereas stem-up genes are not significant. (E) A heatmap of 26 gene expression profiles in root and stem. All the genes shown are involved in the co-expression network of Cotton_A_24525 (GaGSTU7). Genes highlighted with red rectangles have root-up H3K4me3 modification. (F) The average FPKM value of the 9 co-expression genes highlighted in (E) are compared to control root and stem tissues. (G) The H3K4me3 profiles in UCSC genome browser. Gene Cotton_A_24525 and its co-expressed gene Cotton_A_16536 with root-up modification are presented.

