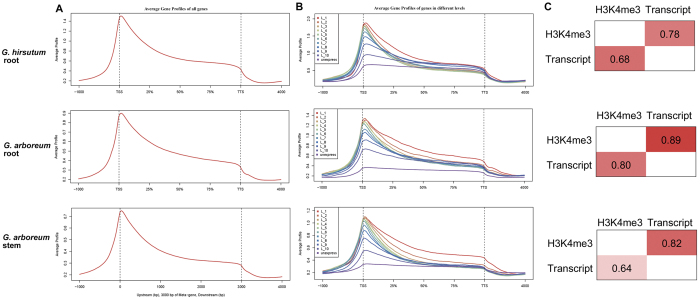
Figure 3.
H3K4me3 associated with gene structure and expression. (A) The average gene profiles of H3K4me3 in cotton root and stem were generated from CEAS software using normalized sequencing read density. The gene body was divided into three equal parts to standardize different gene lengths, and the 1 kb upstream and downstream regions were also included for profile making. (B) The average gene profiles of H3K4me3 among different expression levels. Genes are divided into 11 groups according to their expression (FPKM value). The genes having FPKM > 0 are divided into 10 equal parts and the remaining genes which have FPKM = 0 are gathered and tagged as “unexpressed”. L1 is the highest-level group and is marked in red. L10 is the lowest level and is marked in dark blue. (C) The relationship between histone modification and active transcript expression. The numbers are standard for concurrence frequency computation for H3K4me3 histone modifications and active transcripts. For example, 0.78 means that 78% active transcripts contain the H3K4me3 modification in G. hirsutum root.

