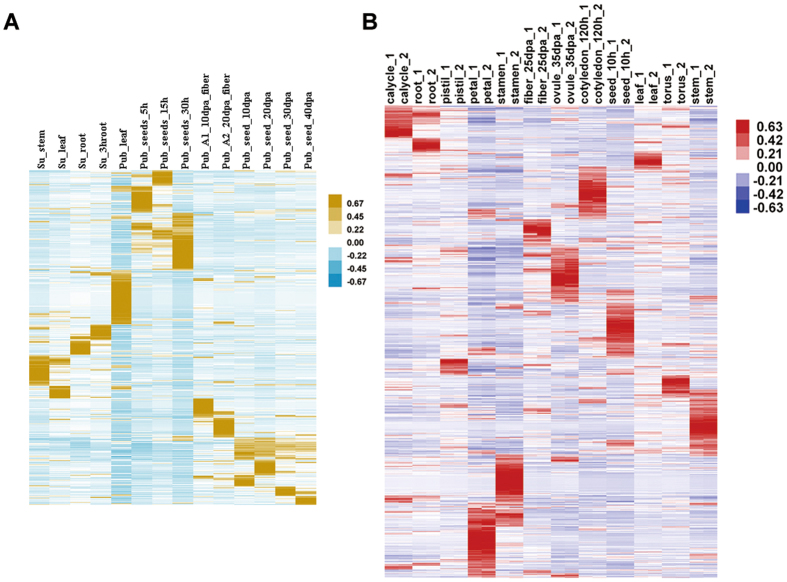
Figure 7.
Differential expression situation of novel transcripts. (A) Heatmap clustering of newly identified transcripts in G. arboreum among 14 expression profiles of six different tissues, including stem, root and leaf, fibre, seed and seedlings The “Su” stands for in-house data, and the “Pub” stands for public data. Each coloured box indicates the z-score. (B) Heatmap clustering of newly identified transcripts in G. hirsutum among 24 expression profiles from twelve different tissues, including torus, calycle, pistil, stamen, petal, leaf, stem, root, seed, cotyledon, ovule and fibre. Each box indicates the z-score.

