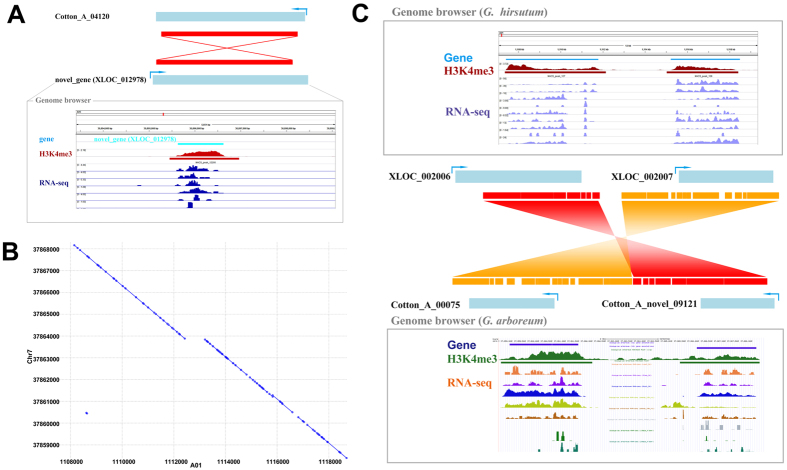
Figure 8.
Synteny analysis between G. hirsutum and G. arboretum. (A) The Blastn result between the G. arboreum gene Cotton_A_04120 and a novel transcript in G. hirsutum XLOC_012978. The red rectangles indicate alignment regions with high scores. The lower panel presents profiles of H3K4me3 and RNA-seq surrounding XLOC_012978 in SVG software. (B) Detail of the reverse synteny regions between chromosome Chr7 (37,868,000 to 37,859,000) in G. arboreum and A01 (1,108,000 to 1,118,000) in G. hirsutum. (C) Detail of the known genes and novel transcripts in the (B) synteny region. XLOC_002006 and XLOC_002007 are novel transcripts in G. hirsutum. The novel transcript Cotton_A_novel_09121 in G. arboreum shares a reverse collinearity relationship with XLOC_002006. The known gene Cotton_A_00075 in G. arboreum shares a reverse collinearity relationship with XLOC_002007.

