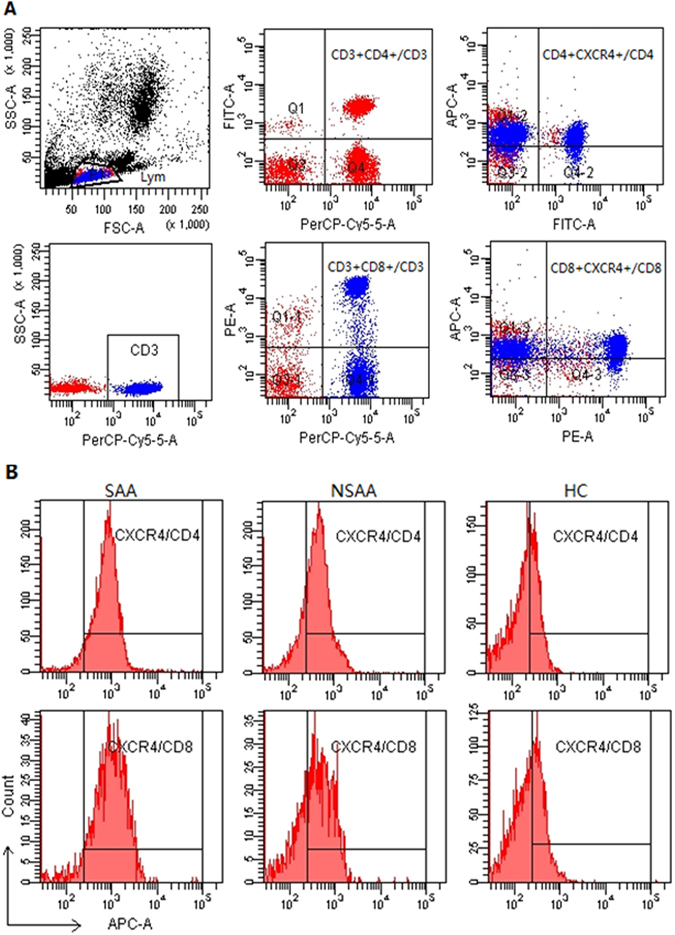
Figure 3.

Flow cytometry of CXCR4 expression on CD4+ and CD8+ T-cells. (A) Scatter plots of flow cytometry. Gating on the CD3+ T-cells, the frequencies of CD4+ and CD8+ T-cells were calculated. Gating on the CD4+ T-cells and the CD8+ T-cells allowed us to calculate the frequencies of CD4+CXCR4+ T-cells and CD8+CXCR4+ T-cells, respectively. (B) Representative histograms of CXCR4 expression on CD4+ and CD8+ T-cells for three groups. SAA: severe aplastic anaemia; NSAA: non-severe aplastic anaemia; HC: healthy control.
