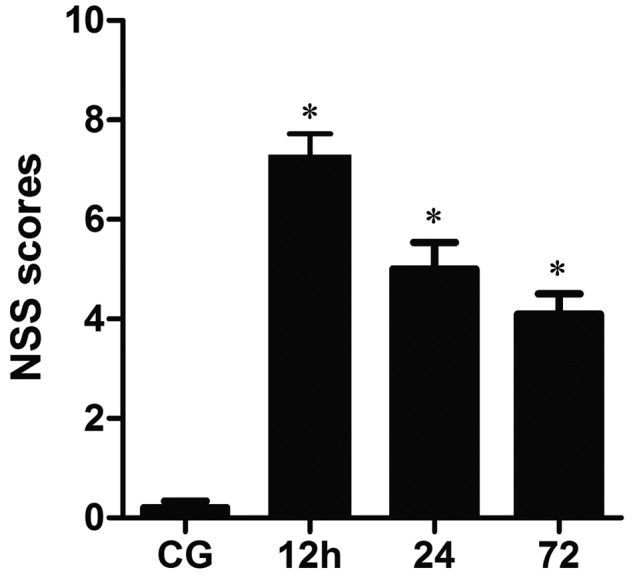
Figure 1. The changes in NSS at 12, 24, 72 h post-injury and in the CG.

Significant increases occur in the average NSS following TBI in contrast with CG, but a progressive decrease from 12 to 72 h post-injury (*P<0.05).

Significant increases occur in the average NSS following TBI in contrast with CG, but a progressive decrease from 12 to 72 h post-injury (*P<0.05).