
Figure 1.
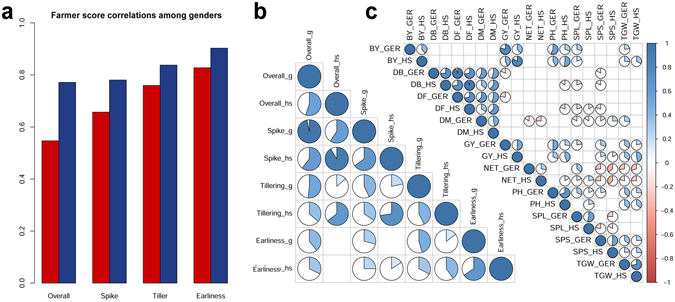
Farmer score and phenotype correlations between genders and between locations. (a) Score consistency between genders in the two locations. On the y axis, Spearman correlation coefficients (all significant). Red bars represent correlation values between men and women scores in Hagreselam, blue bars represent those correlations in Geregera. Gender correlations are higher in agronomic traits, earliness and tillering, and lower in quality traits, spike and overall. (b) PE scores consistency between the two locations (“h” for Hagreselam and “g” for Geregera). The value of Spearman’s correlations is shown by the width of pie slices colored according to the bar on the far right. The combinations without pie charts correspond to non-significant correlations. (c) Correlation plot of metric measures of agronomic traits in the two locations. Correlation values are shown as in panel (b), phenotype codes as in Materials and Methods. NET and BY were the agronomic traits most varied across locations.