
Figure 4.
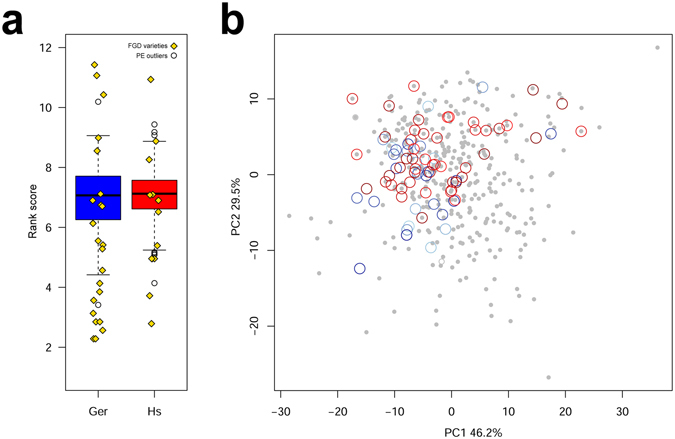
Ranking order of PE varieties. (a) Comparison between ranking score distributions in the two locations. Blue boxplot (Ger), Geregera; red boxplot (Hs), Hagreselam. Hollow circles outside upper and lower quartiles are outliers. Yellow diamonds are FGD varieties. (b) Top 50 PE wheat varieties in relation to phenotypic values. The panel depicts the first two PC axes extracted from metric measures of phenotypes averaged across the two locations. The top 50 varieties in Hagreselam and Geregera are represented by hollow circles in progressively darker red shades and blue shades, respectively. Twenty varieties were simultaneously selected in Hagreselam and in Geregera. Gray dots represent PE genotypes ranked 51 to 400. Preferred varieties in both locations are grouped in the top-left portion of the PC space.