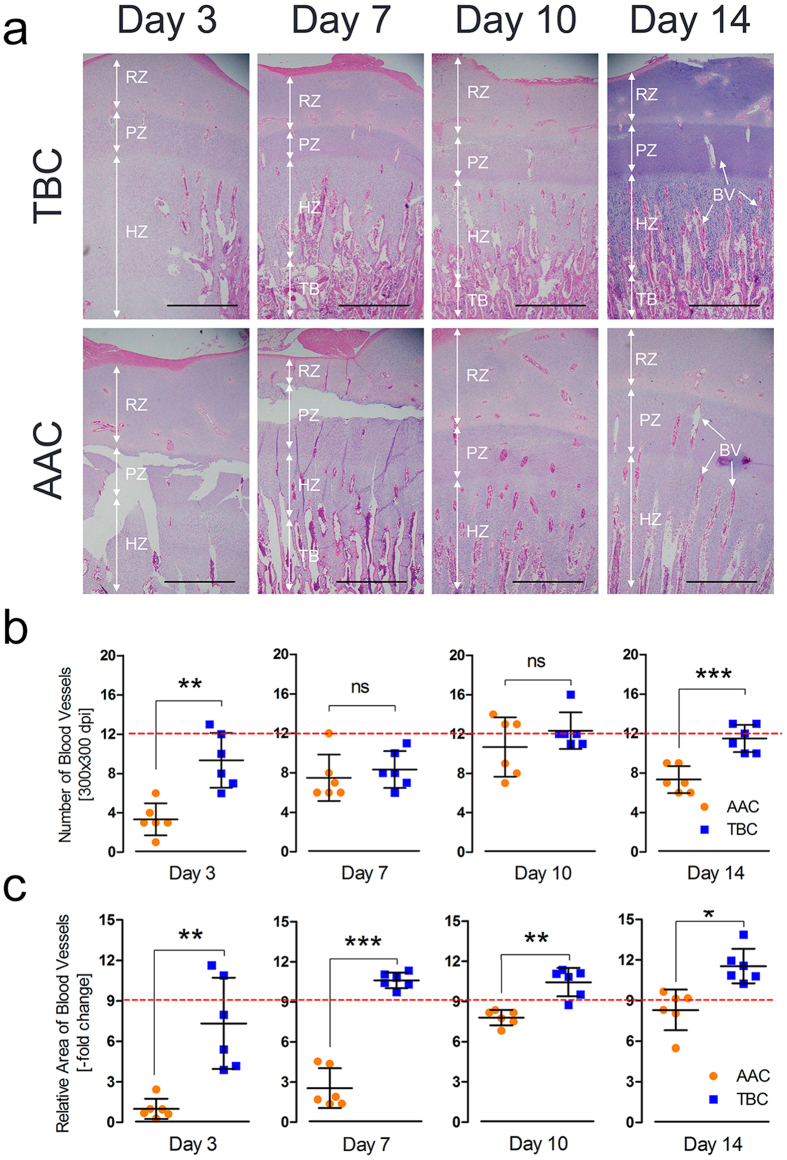
Figure 2.
Higher tibial vascular distribution in the hypertrophic chondrocyte zones of TBCs. (a) Tibial vascular distribution was significantly increased in TBCs compared to AACs. The arrows indicate BVs (blood vessels); RZ, resting chondrocyte zone; PZ, proliferative chondrocyte zone; HZ, hypertrophic chondrocyte zone; and TB, trabecular bone. Scale bar = 500 µm. (b,c) The relative BV area and BV number were determined from two isolated groups using Image-Pro® Plus 6.0. Student’s t-test, * p < 0.05, ** p < 0.01, *** p < 0.001, n = 6; Error bars indicate SD. ns, not significant. AAC, Arbor Acres chicken; TBC, Tibetan chicken.

