


Figure 3.
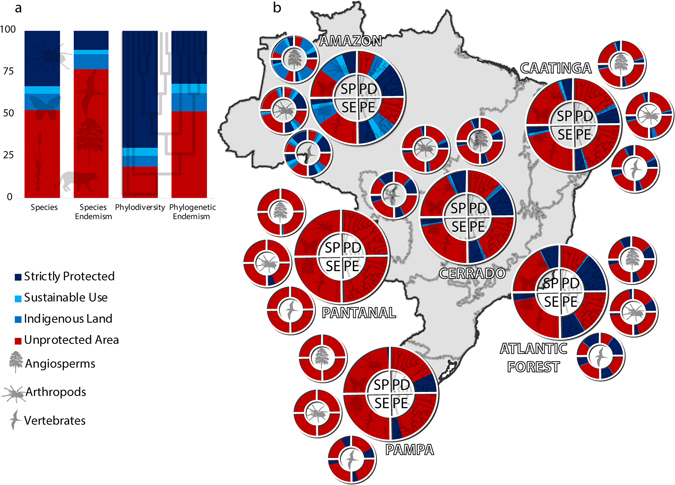
Proportion of protection for each dimension of biodiversity (species, endemism, phylodiversity and phylogenetic endemism) inside each PA category. The endemism is the proportion of the sum of the index of endemism of all Brazilian species and lineages analysed. Results are shown for the entire Brazilian territory (a) and for each Brazilian biome (b). Each circular chart indicates a biodiversity dimension inside each quadrant (SP = species, PD = phylogenetic diversity, SE = species endemism, PE = phylogenetic endemism. The smaller graphs show the results for each taxonomic group separately (angiosperms, arthropods and vertebrates). Map created in ArcGIS 10.1 (http://www.esri.com).