
Figure 2.
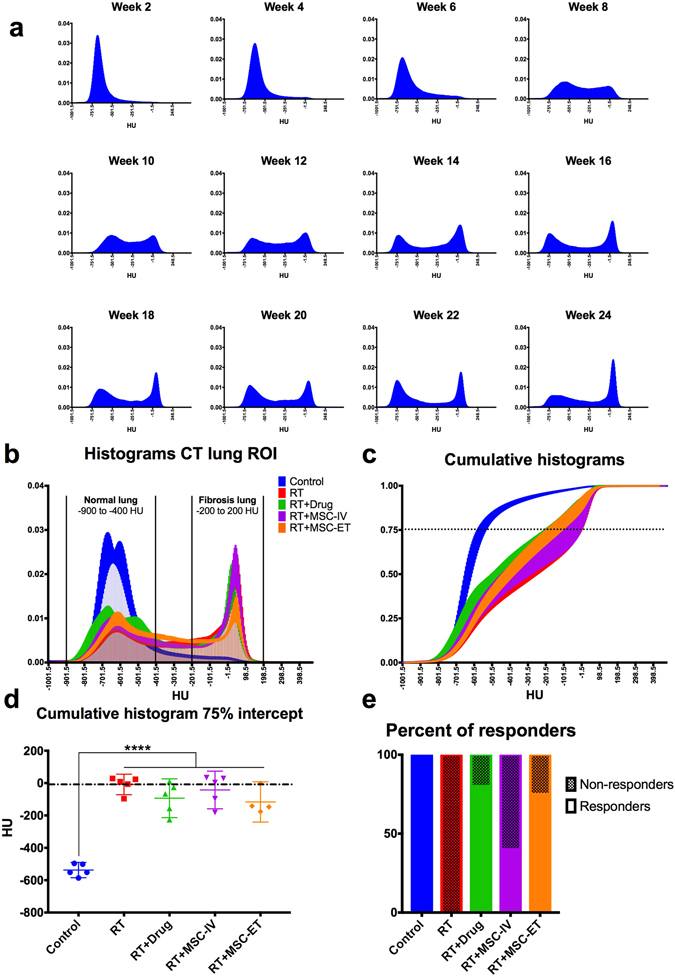
(a) CT histograms of lung ROI from a representative irradiated rat over time from week 2 to 24 post-RT. Histograms represents the portion of voxels within the lung ROI at a certain density (HU). (b) CT histograms for all groups at week 24 post-RT. (c) Cumulative histograms at week 24 post-RT. Dotted line at the 75% intercept line to maximize separation between groups. (d) HU value of the 75% intercept from the cumulative histogram for each group. Bar represents the mean with 95% CI and each point is a rat. There is a significant difference between the Control and all RT groups. Dashed line was set at the mean of the RT group. (e) Percent of rats exhibiting a response to treatment. Rats falling under the mean of the RT groups (dashed line from (d)) are considered “responders” (closer to Controls) and rats above the RT mean are considered “non-responders”.