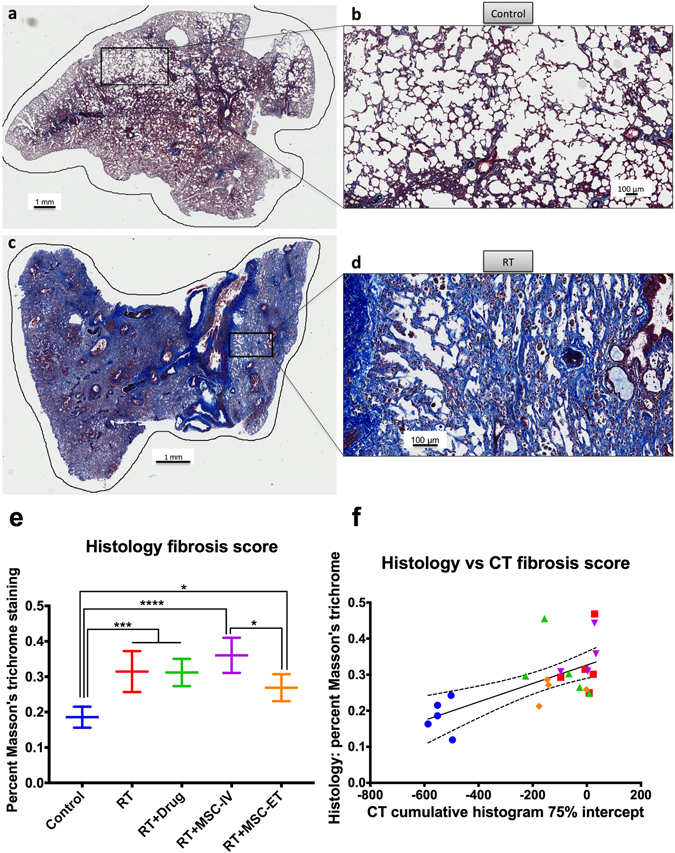
Figure 3.

Histopathology of representative lung sections stained for fibrosis with Masson’s trichrome. (a) Control whole slide. (b) Control zoomed in. (c) RT whole slide. (d) RT zoomed in. Fibrosis appears in blue. (e) Histopathology fibrosis score quantified with percent of blue pixels for each group. There is a statistical difference between Control and all RT groups and between RT + MSC-IV and RT + MSC-ET. (f) Plot of histopathology vs CT fibrosis score. Each rat is one point and the line represents the linear regression fit.
