
Figure 1.
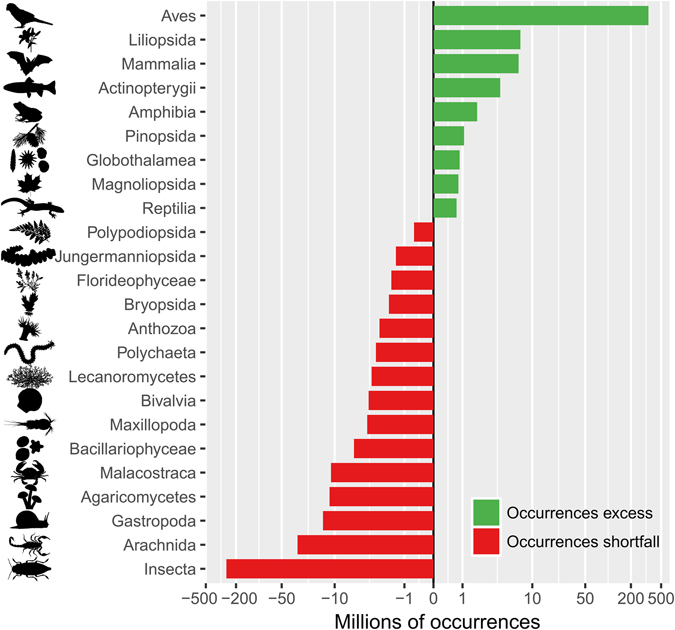
Taxonomic bias in biodiversity occurrence data. The vertical line at x = 0 depicts the ‘ideal’ number of occurrences per class, where each class is sampled proportionally to its number of known species. Green and red bars show the classes that are over- and under-represented in the GBIF mediated database compared to this ‘ideal’ sampling, respectively. Insects lack >200 millions occurrences and birds have an excess of >200 millions occurrences compared to an unbiased taxonomic sampling. Because birds and insects are greatly over- and under-represented, respectively, an inverse hyperbolic sine transformation was used for the x-axis.