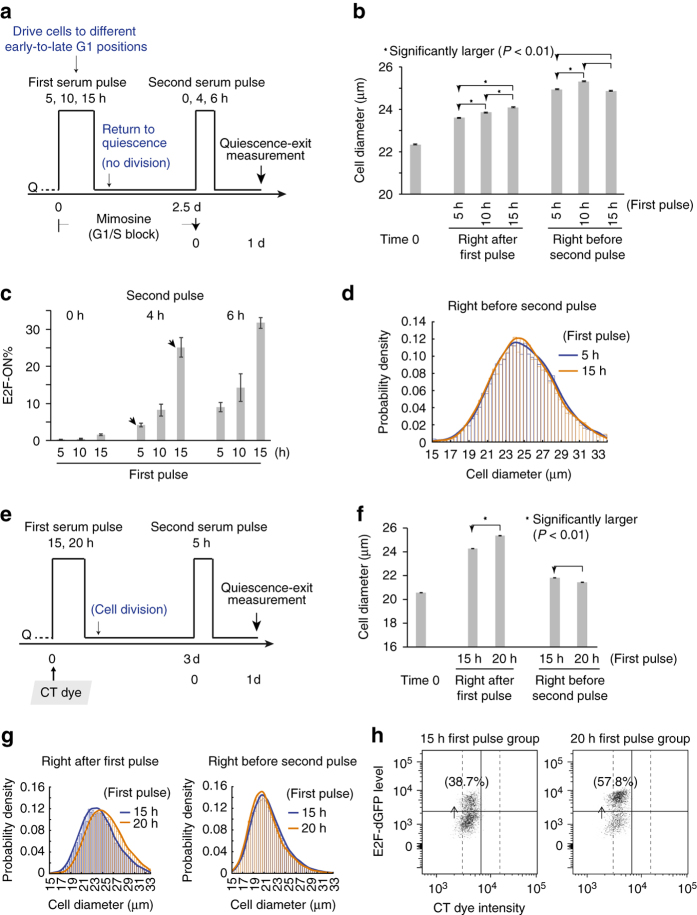
Fig. 2.
Quiescence-exit likelihood is correlated with cell size at quiescence induction. a Experimental scheme. E2F-dGFP activity was measured one day after the initiation of the second serum pulse. See text for details. b Cell size measured right before the first serum pulse (time 0), after the first pulse (of 5–15 h), and before the second serum pulse, following the scheme in a. Star sign indicates statistical significance P < 0.01) in one-sided (arrow pointed) t-test comparing the means of cell diameters in two cell populations (20,000–30,000 cells each). Error bar, s.e.m. c Quiescence-exit rate (E2F-ON%, mean ± s.e.m. of duplicates) in response to the second serum pulse for indicated durations as a function of the first serum pulse duration. d Probability density distribution of the cell size (diameter) of indicated cell samples in b right before the secnd serum pulse. The histogram curve represents a kernel smoothing fit of cell size distribution (the same below). e Experimental scheme. Quiescent cells were stained with CT violet dye at time 0, and E2F-dGFP activity was measured one day after the second pulse initiation. See text for details. f Cell size measured right before the first serum pulse (time 0), after the first pulse, and before the second pulse, following the scheme in e. The star sign and error bar are as in b. g Probability density distributions of cell size (diameter), of indicated cell samples in f. h Scatter plots of flow cytometry results. Percentages of E2F-ON cells following the 2nd pulse are shown. Each dot represents one single cell. Cells to the left of solid vertical line corresponded to divided cells following the first serum pulse (same gating as in Fig. 3c)

