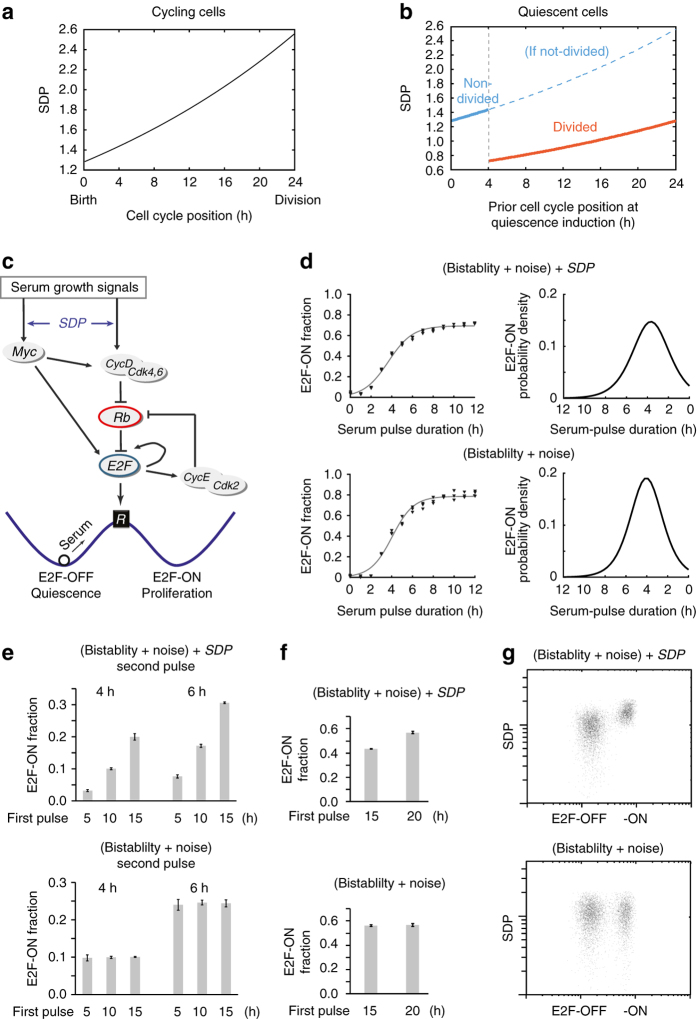
Fig. 4.
Model the memory effects of preceding cell growth and division on quiescence exit. a SDP accumulation in a cycling cell from cell birth to division, during which SDP value doubles. Cell cycle position refers to the hours after cell birth, in the presence of serum. b SDP distribution in a population of quiescent cells, related to preceding cell cycle positions at quiescence induction. Cells past the R-point (4 h after cell birth) enter quiescence after division with SDP reduced by half. c Rb-E2F bistable network that mediates the all-or-none transition from quiescence-to-proliferation. See text for details. d–g Simulation results based on the stochastic SDP-Rb-E2F model (top) vs. stochastic Rb-E2F model without SDP (bottom). d (left) Each data point represents the E2F-ON fraction calculated from 1000 simulations. Sigmoid curve indicates a best fit of triplicate data points (with the function form as in Fig. 1b). (right) Quiescence-exit distribution as the derivative of the sigmoidal curve on the left. e, f Each column represents the E2F-ON fraction (mean ± s.e.m.) calculated from three sets of stochastic simulations (500 runs each). Cells were simulated according to experimental schemes in Fig. 2a, e (with batch-variation factor S c = 0.55 and 1.15 for the second pulse, respectively). g Results from 5000 simulated cells are shown according to experimental procedure in Fig. 1d (pd = 3.5 h). Each dot represents one stochastic simulation of a single cell. Each cell was randomly assigned a SDP value (in log-normal distribution, y axis), with or without (top and bottom, respectively) coupling to serum response elements in the Rb-E2F bistable model. The x axis indicates the simulated E2F molecule number at the 24th model hour after serum pulse initiation (plus autofluorescence assumed in log-normal distribution, mean = 100)

