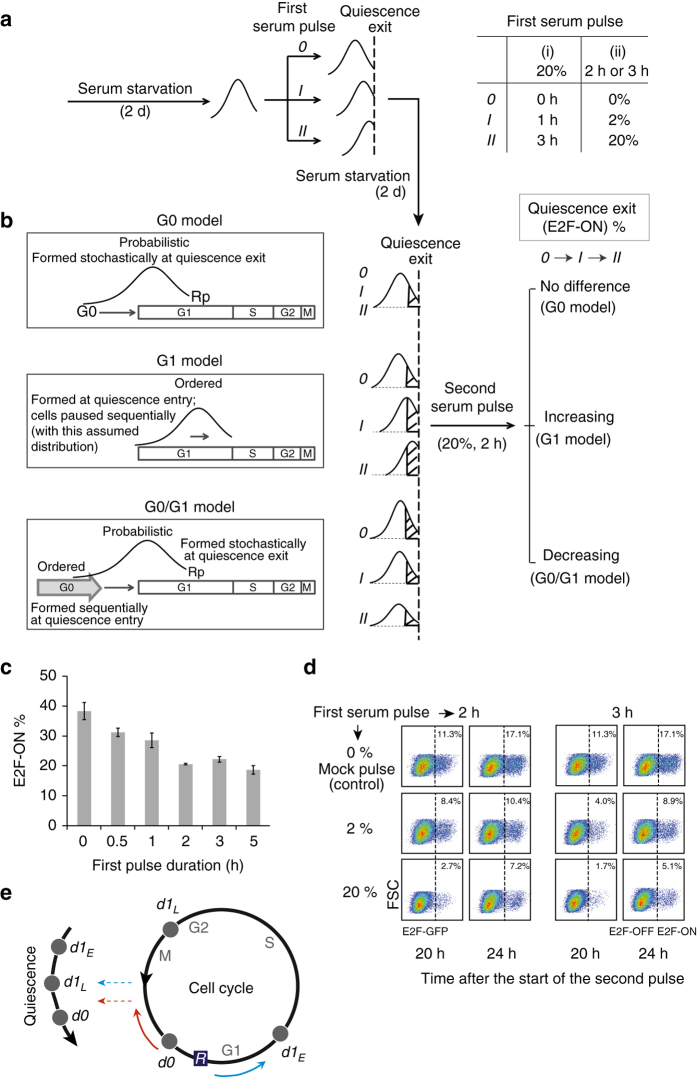
Fig. 5.
Experimental tests of three competing quiescence models. a, b Experimental schemes. See text for details. Two sets of first serum pulse with increasing duration (i) or concentration (ii) are shown on the right of a. Three competing models (G0, G1 and G0/G1) for quiescence, with their explanations of quiescence-exit heterogeneity (probabilistic, ordered and both, respectively) are shown on the left in b. Rp, restriction point. c, d Following experimental schemes in a and b, after the first serum pulse of increasing durations (0–5 h at 20%, c) or increasing concentrations (0–20% for either 2 or 3 h, d), cells were returned to quiescence by serum starvation, and then subject to the second serum pulse. Percentages of E2F-ON cells were measured at the 24th hour (c, mean ± s.e.m. of triplicates) or at the 20th and 24th hour d after the initiation of the second serum pulse. e The new quiescence model. Quiescent cells are located in the G0 state outside of the cell cycle while arrayed in a sequence reflecting their preceding cell growth and division, which together with noise in the Rb-E2F bistable system, determines quiescence-exit likelihood (d0: non-divided cells, d1 L and d1 E: divided cells previously at late and early cell cycle positions at quiescence induction, respectively)

