
Figure 4.
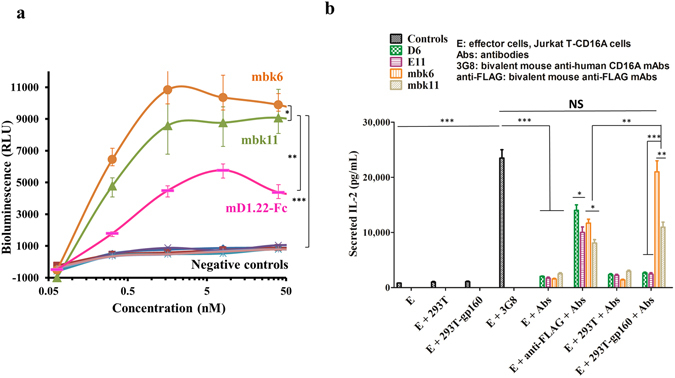
Activation and IL-2 release by Jurkat T-CD16A cells after CD16A engagement by anti-CD16A antibodies or BiKEs. Activation was measured by monitoring luciferase activity. IL-2 secretion was tested by sandwich ELISA by using the Duoset Human IL-2 kit from R&D Systems. (a) Luciferase activity (Unit, RLU; RLU stands for relative light unit) of Jurkat T-CD16A cells after incubation with BiKEs or mD1.22-Fc. Experiments were performed in triplicate.  Represents Jurkat T-CD16A cells incubated with mbk6 and 293T-gp160SC cells (Jurkat T-CD16A + mbk6 + 293T-gp160SC, simply denoted as mbk6 in the figure);
  , Jurkat T-CD16A + mbk11 + 293T-gp160SC (denoted as mbk11);
  , Jurkat T-CD16A + mD1.22-Fc + 293T-gp160SC (simply put as mD1.22-Fc); other groups are negative controls, in which Jurkat T-CD16A cells was either incubated with BiKEs in the absence of target cells, or incubated with BiKEs in the presence of gp160SC negative 293 T cells.
  , Jurkat T-CD16A + mbk6;
  , Jurkat T-CD16A + mbk6 + 293 T;
  , Jurkat T-CD16A + mbk11;
  Jurkat T-CD16A + mbk11 + 293 T;
  , Jurkat T-CD16A + mD1.22-Fc;
  , Jurkat T-CD16A + mD1.22-Fc + 293 T. (b) Secretion of IL-2 by Jurkat T-CD16A cells activated by BiKEs at 20 nM. The results shown are from three independent experiments. Statistical tests were performed using GraphPad Prism5. Significant differences when comparing two groups were determined by two-way ANOVA (panel a) and Student’s t test (panel b). A two-tailed p value < 0.05 was considered significant. *p < 0.05. **p < 0.01. ***p < 0.001. NS: not significant.