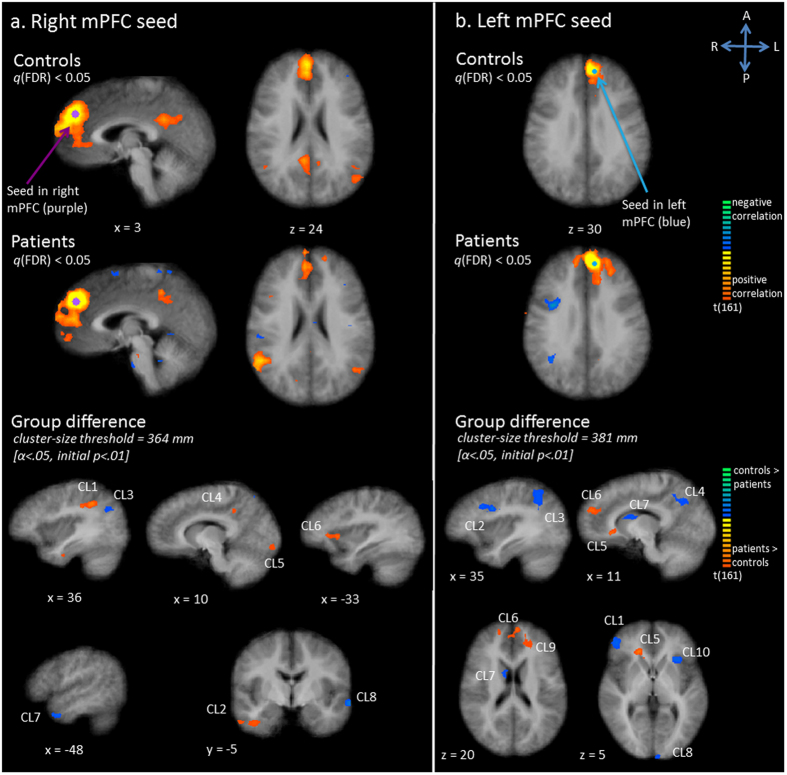
Figure 1.
Functional connectivity (Fc) maps for the medial prefrontal cortex (mPFC) as seed; panel a: right mPFC seed, panel b: left mPFC seed. Upper and middle row: Statistical maps resulting from the seed-based correlation analysis separate per group (red indicates positive correlation, blue indicates negative correlation). Seeds are overlaid in purple (right mPFC seed) or blue (left mPFC seed). Maps are thresholded at q(FDR) < 0.05. Lower row: Group differences in functional connectivity per seed region (red indicates patients show increased connectivity as compared to controls, blue indicates patients show decreased connectivity as compared to controls).

