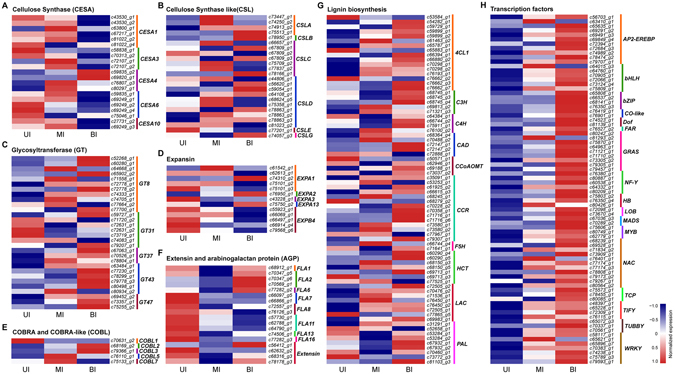
Figure 7.

Expression profiles of cell wall biosynthesis genes and transcription factors during internode development. The heatmap was generated with Z-score normalized FPKM values. Up-regulated genes are shown in red, whilst down-regulated genes are in blue. (A) expression profiles of cellulose synthase genes. (B) expression patterns of cellulose synthase-like genes. (C–F) expression analysis of genes encoding cell wall structural proteins. (G) expression profiles of monolignol biosynthesis genes. (H) expression patterns of transcription factor genes. UI, upper internode, MI, middle internode, BI, basal internode.
