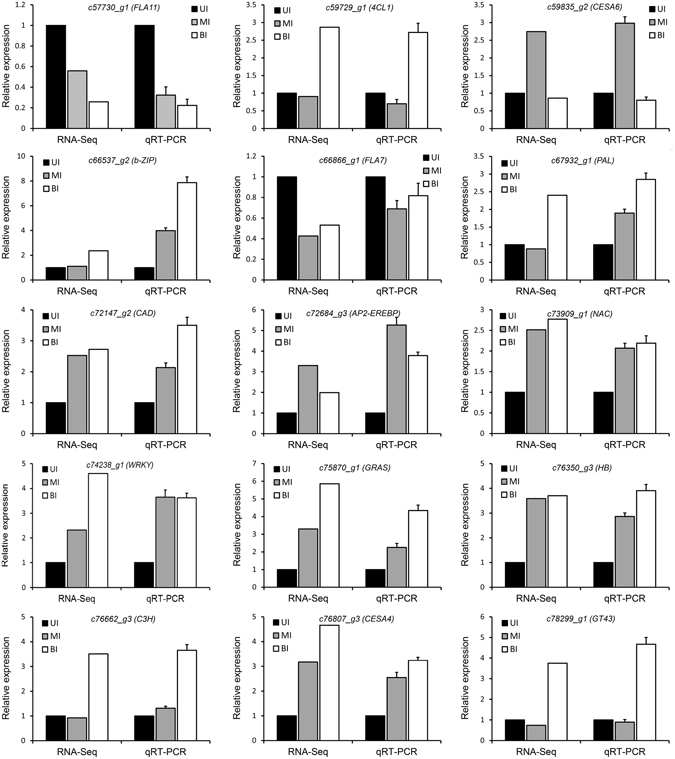
Figure 9.

Validation of gene expression by quantitative real time RT-PCR. The expression of the UI was set as 1.0, and the relative expression level was calculated. UI, upper internode, MI, middle internode, BI, basal internode.

Validation of gene expression by quantitative real time RT-PCR. The expression of the UI was set as 1.0, and the relative expression level was calculated. UI, upper internode, MI, middle internode, BI, basal internode.