Figure 1.

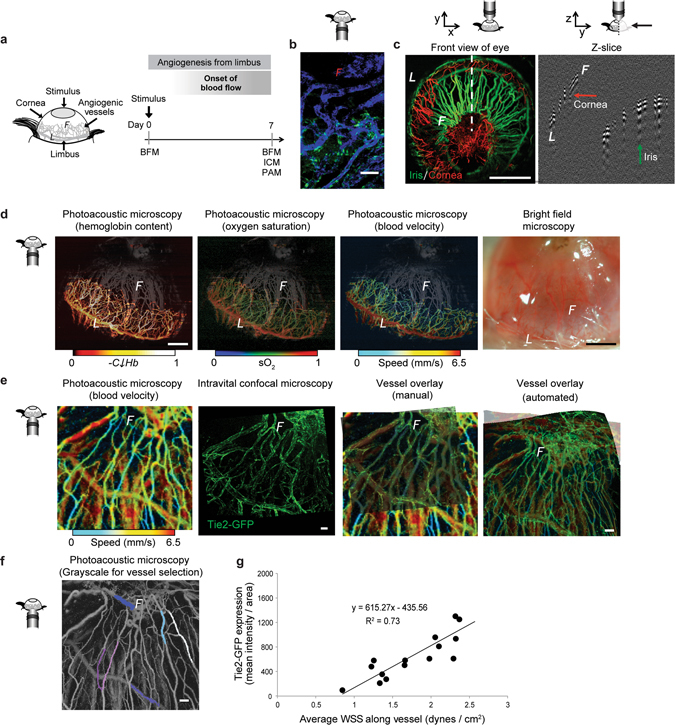
Functional imaging of vascular and cellular activity. (a) Schematic of corneal angiogenesis assay in which blood vessels grow from the limbus (“L”) into the avascular cornea, creating an angiogenic front (“F”) as they develop toward an angiogenic stimulus (gray oval). (b) Fluorescence intensity of Tie2-GFP (green) along vessels (perfused with IB4-lectin-647, blue) throughout the network (day 7 shown). (c) PAM distinguishes between the iris (green) and corneal (red) vasculatures, due to their different depths. Green arrow points toward iris vessels; red arrow toward corneal neovessels in the Z-slice. (d) Unlike BFM, PAM permits functional imaging of relative hemoglobin content (“CHb”), sO2 saturation, and blood velocity in the angiogenic corneal network (day 7 shown). The iris vasculature, pseudo-colored in gray based on vessel depth, is visible in the background of each image. (e) Overlayed images of the same field of view acquired at day 7 using PAM (blood flow velocity) and ICM (GFP fluorescence intensity), done both manually and with automated software (PT Gui) enables correlation between blood flow-induced wall shear stress (WSS) and GFP fluorescence intensity. (f) Grayscale image of same PAM field of view as shown in “d” to facilitate vessel identification. Pseudo-coloring of vessels (white, dark blue, light blue, pink, purple, fuchsia) to exemplify those that were quantified for evaluation in the study. (g) Tie2-GFP fluorescence intensity in individual vessels versus average WSS in those vessels calculated using blood velocity maps obtained with PAM, such as those shown in “d”. R2 = 0.73 for comparison of 18 vessel segments from four mice. Small schematics next to each microscopy image indicate the direction of the objective relative to the cornea during imaging. Scale bars indicate (c,d) 1 mm, (b,e,f) 50 µm.
