Supplemental Digital Content is available in the text.
Keywords: catecholamines, cholesterol, insulin, natriuretic peptides, triglycerides
Abstract
Objective—
Fatty acids released via fat cell lipolysis can affect circulating lipid levels. However, the contribution of different lipolysis measures in adipose tissue is unknown and was presently examined in isolated subcutaneous adipocytes.
Approach and Results—
One thousand and sixty-six men and women were examined for lipolysis regulation in subcutaneous abdominal fat cells. Results were compared with fasting plasma levels of total cholesterol, high-density lipoprotein (HDL) cholesterol (HDL-C) and triglycerides. Spontaneous (basal) lipolysis and the effects of the major hormones stimulating (catecholamines and natriuretic peptides) and inhibiting lipolysis (insulin) were examined. Several statistically significant (P<0.0001) correlations between the different lipolysis parameters and plasma lipids were observed. However, physiologically relevant correlations (adjusted r2≥0.05) were only evident between basal or insulin-inhibited lipolysis and plasma triglycerides or HDL-C. Together, these lipolysis measures explained 14% of the variation in triglycerides or HDL-C, respectively. In comparison, a combination of established factors associated with variations in plasma lipids, that is, age; body mass index; waist circumference; waist-to-hip ratio; sex; nicotine use; fat cell volume; and pharmacotherapy against diabetes mellitus; hypertension; or hyperlipidemia explained 17% and 28%, respectively, of the variations in plasma triglycerides and HDL-C.
Conclusions—
Subcutaneous fat cell lipolysis is an important independent contributor to interindividual variations in plasma lipids. High spontaneous lipolysis activity and resistance to the antilipolytic effect of insulin associate with elevated triglyceride and low HDL-C concentrations. Thus, although several other factors also play a role, subcutaneous adipose tissue may have a causal influence on dyslipidemia.
Highlights.
The impact of subcutaneous fat cell lipolysis on circulating lipid levels is not known.
In a cohort of >1000 individuals, we demonstrate that basal and insulin-inhibited lipolysis correlates with circulating triglyceride and high-density lipoprotein cholesterol levels.
The 2 lipolytic measures explained almost 15% of the interindividual variations in triglyceride and high-density lipoprotein cholesterol.
It is now well established that elevated circulating cholesterol and triglycerides are important and independent risk factors for atherosclerotic cardiovascular disease.1,2 The regulation of plasma lipid levels is dependent on a variety of intrinsic and extrinsic factors.3–6 Bearing in mind the well-known role of fatty acids in dyslipidemia,7–11 one relevant endogenous factor could be fat cell lipolysis, a process that results in the release of free fatty acids (FFAs) to the circulation.8 FFAs are used for hepatic production of very-low-density lipoprotein triglycerides, which in turn may reduce high-density lipoprotein (HDL) cholesterol (HDL-C) levels by increasing the transfer of triglycerides to HDL.7,12,13 These triglyceride-rich HDL particles are subsequently hydrolyzed by hepatic lipase14 leading to formation of remnant HDL.15 Consequently, a high lipolysis rate might result in hypertriglyceridemia and low HDL-C levels.7,8,12 The release and storage of adipose FFAs is determined by the turnover of fat cell triglycerides. We recently developed a method to determine adipocyte lipid turnover in free living humans16 and could demonstrate that common and genetic forms of dyslipidemia were linked to altered triglyceride turnover, which in turn was proportional to subcutaneous adipocyte lipolysis activity.16,17 Given that subcutaneous adipose tissue constitutes the by far largest fat depot, these studies suggest that fat cell lipolysis may, at least in part, affect circulating lipid levels.
Lipolysis in human fat cells has a unique regulation compared with rodents.18–20 Thus, human adipocytes display a substantial spontaneous (basal) lipolytic activity and catecholamines and natriuretic peptides are the only hormones with a pronounced prolipolytic activity. The effects of natriuretic peptides in adipocytes of humans and primates contrast with rodent cells where these agents display no effect. In both humans and rodents, insulin is the major antilipolytic hormone.
Despite the well-known impact of lipolysis on circulating lipids in man, surprisingly few studies have directly examined fat cell lipolysis. Thus, most are small cohort studies on subcutaneous fat cells in hereditary forms of dyslipidemia, that is, endogenous hypertriglyceridemia or familial combined hyperlipidemia.21–26 These investigations have reported normal basal but blunted pro- and antilipolytic effects of catecholamines and insulin, respectively. One study investigated visceral fat cell lipolysis in 45 subjects who were not selected according to circulating lipid levels.27 An inverse relationship was observed between catecholamine-stimulated lipolysis and HDL-C but not with triglyceride levels.
Although the few published studies discussed above suggest that adipocyte lipolysis might influence circulating lipid levels, several unanswered questions remain. How much does subcutaneous fat cell lipolysis contribute? What are the relative roles of basal lipolysis and lipolysis induced by different hormone systems? What is the influence of important intrinsic and extrinsic factors such as age, sex, body mass index, body fat distribution, nicotine use, or concomitant medication? To answer these questions, we conducted a large study (>1000 subjects) on abdominal subcutaneous fat cells examining the possible relationships between basal and hormone-regulated lipolysis on the one hand and fasting plasma levels of total cholesterol, HDL-C, and triglycerides, on the other hand.
Materials and Methods
Materials and Methods are available in the online-only Data Supplement.
Results
We first investigated the correlations between each of the fat cell lipolysis and plasma lipid measures by single linear regression (Table 1). The relationship between several circulating lipid and lipolysis measures were statistically significant. In many cases, however, the level of correlation as determined by adjusted r2 values was low (<0.05) and was not considered to be physiologically relevant. On the contrary, the correlations between antilipolytic insulin sensitivity or basal lipolysis and plasma triglyceride or HDL-C were stronger (adjusted r2=0.05–0.11) and, therefore, selected for further investigations. Basal lipolysis was negatively correlated with HDL-C and positively with triglycerides (Figure 1A), whereas the opposite relationships were observed for antilipolytic insulin sensitivity (expressed as pD2, ie, the negative 10 log molar value of the half maximum effective hormone concentration; Figure 1B). When dividing the subjects into tertiles according to HDL-C and triglyceride levels, basal lipolysis and antilipolytic insulin sensitivity were significantly different between the 2 extreme groups (ie, high HDL-C/low triglyceride versus low HDL-C/high triglyceride; Figure 1C and 1D). The cohort included obese (n=599) and nonobese (n=467) subjects. The relationships between HDL-C and triglyceride for basal lipolysis were stronger in nonobese subjects (HDL-C: nonobese r=−0.27, P<0.0001; obese r=−0.10, P=0.012 and triglycerides: nonobese r=0.27, P<0.0001; obese r=0.12, P=0.0035). For antilipolytic insulin sensitivity, the corresponding numbers were for HDL-C: nonobese r=0.17, P=0.044; obese r=0.14, P=0.017 and triglyceride: nonobese r=−0.31, P=0.0003; obese r=−0.21, P=0.0002. Altogether, these results suggest that basal lipolysis is better associated with HDL-C/triglycerides in nonobese compared with obese subjects. In contrast, antilipolytic insulin sensitivity is strongly associated with triglycerides in both nonobese and obese subjects. Twenty-nine individuals were on treatment against antihyperlipidemia, and 61 subjects against type 2 diabetes mellitus. These groups were too small to allow a reliable subgroup analysis. Nevertheless, removing these individuals from the analyses provided similar r and P values as in Table 1 (data not shown). Moreover, there was no sex interaction in the relationships between basal lipolysis or antilipolytic insulin sensitivity and HDL-C or triglycerides (F=0.1–2.4; P=0.12–0.76).
Table 1.
Correlation Between Subcutaneous Adipose Lipolysis and Fasting Plasma Lipid Levels

Figure 1.
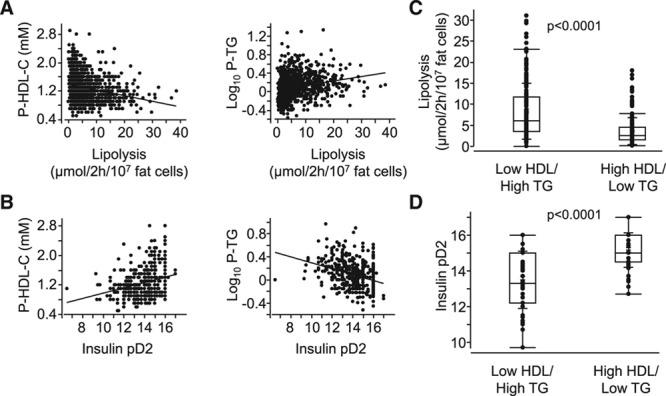
Relationship between adipocyte measures of lipid handling and dyslipidemia. A, Basal lipolysis or (B) antilipolytic insulin sensitivity (insulin pD2) was compared by linear regression with high-density lipoprotein cholesterol (HDL-C) and triglycerides (TGs), respectively. r and P values are detailed in Table 1. C and D, The same adipocyte measures are presented in box plots and were compared in subjects with the highest tertile HDL-C/lowest tertile TG levels (n=184) with that in individuals with the lowest tertile in HDL-C/highest in TG (n=182). Both measures were significantly different in the 2 groups using unpaired t test. P values are indicated.
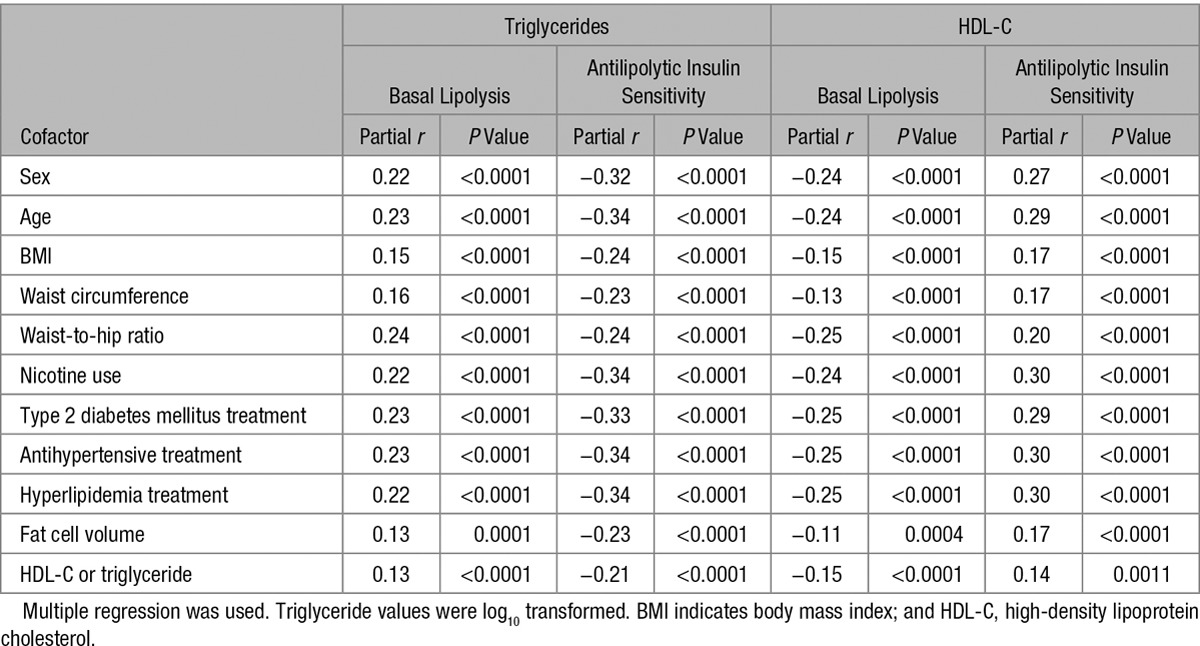
We next investigated whether the relationships between antilipolytic insulin sensitivity/basal lipolysis and triglyceride/HDL-C remained after correction for intrinsic/extrinsic factors known to influence circulating lipid levels (Table 2). This demonstrated that the lipolysis/plasma lipid relationships were still highly significant (P<0.0001) after correction for sex; age; body mass index; waist circumference; waist-to-hip ratio; nicotine use; treatment of type 2 diabetes mellitus, hypertension, or hyperlipidemia; and fat cell size. As expected, several of the cofactors correlated significantly with the plasma lipid levels in Table 2. On the contrary, most of these correlations were weak (adjusted r2<0.05). For HDL-C, the only relevant relationships were observed with fat cell size and waist-to-hip ratio (adjusted r2=0.14–0.16). For plasma triglycerides, these stronger associations were instead found with body mass index and waist-to-hip ratio (adjusted r2=0.07–0.14).
Table 2.
Relationship Between Fasting Plasma Lipid Levels and Lipolysis in Subcutaneous Fat Cells Corrected for Cofactors
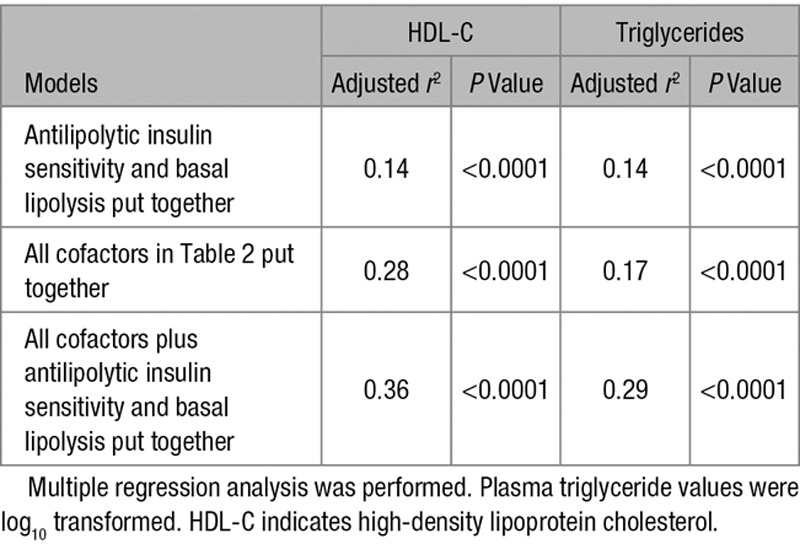
Using different regression models, we also investigated the influence on plasma lipids of combining the cofactors in Table 2 and the 2 lipolysis measures (Table 3). Adjusted r2 for antilipolytic insulin sensitivity and basal lipolysis put together was 0.14 for both triglycerides and HDL-C. In this model, each of the lipolysis measures contributed significantly (P<0.0001) to the variation in lipid levels. All cofactors combined but without lipolysis measures yielded adjusted r2 of 0.17 for triglycerides and 0.28 for HDL-C. These values increased to 0.29 and 0.36, respectively, when basal lipolysis and antilipolytic insulin sensitivity were included in the model.
Table 3.
Influence of Cofactors and Lipolysis Parameters Put Together on Plasma Lipid Levels
We finally made some further studies of basal lipolysis (Figure 1). The rate in isolated fat cells was strongly and positively correlated with the spontaneous rate of lipolysis in pieces of adipose tissue (Figure 2A). Basal rate of lipolysis and pD2 for antilipolytic insulin sensitivity were negatively correlated (Figure 2B). The impact of basal lipolysis on fasting serum FFA levels was also analyzed. When subjects were divided into tertiles according to circulating FFA levels, the basal rate of lipolysis expressed per fat cell number (Figure 2C) or corrected for total body fat mass (Figure 2D) was significantly higher in the highest compared with the lowest tertile. Similar results were observed when basal lipolysis was expressed per tissue fat weight (24% higher in the highest tertile; P=0.0045; graph not shown). There was a linear relationship between total body fat cell lipolysis and circulating FFAs (r=0.19; P<0.0001; Figure 2E, top). Although this association was more evident in men (r=0.34; P<0.0001; Figure 2E, bottom) than in women (r=0.15; P<0.0001; Figure 2E, middle), there was no sex interaction (F=2.6; P=0.11). None of these relationships were observed for insulin pD2 (graphs not shown).
Figure 2.
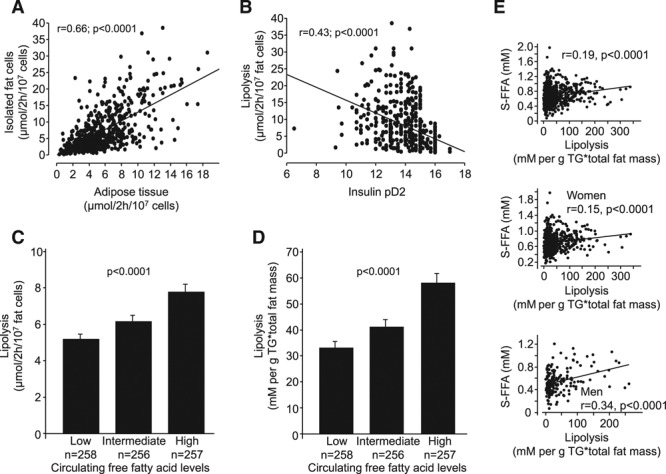
Findings with basal lipolysis. Relationship between lipolysis (determined by glycerol release in isolated fat cells and corrected for fat cell number) and (A) pieces of adipose tissue, (B) insulin pD2, and (C) circulating free fatty acid (FFA) levels subdivided into tertiles. D, There was a similar relationship between basal lipolysis corrected for total body fat mass and circulating FFA levels subdivided into tertiles. E, Basal lipolysis corrected for total fat mass correlated with circulating FFA levels in the entire cohort (top), in women (middle) and men (bottom). Linear regression analysis was used in (A), (B), and (E). r and P values are indicated. Data in (C) and (D) were compared by ANCOVA, overall P value is given.
Discussion
This study sheds new light on the role of subcutaneous fat cell lipolysis in influencing circulating lipid levels. When examining several relevant measures of lipolysis (basal activity or effect of different hormones), only the basal rate and the antilipolytic effect of insulin displayed clinically relevant relationships. Furthermore, the influence of adipocyte lipolysis was only important for plasma HDL-C and triglycerides. These results indicate that resistance to the antilipolytic effect of insulin and a high rate of basal lipolysis are associated with low HDL-C and high triglycerides levels. This dyslipidemic pattern confers increased risk for atherosclerotic cardiovascular disease. Importantly, the observed relationships were independent of classical risk factors influencing plasma lipids such as sex; age; body mass index; body shape; use of nicotine; treatment of hypertension, diabetes mellitus, or hyperlipidemia; and fat cell size.
Is increased lipolytic activity in fat cells clinically important for dyslipidemia? Our results would suggest so. When put together, the 2 lipolytic measures contributed independently and explained 14% of the variations in plasma triglycerides or HDL-C. The influence of lipolysis can be compared with that of the combined risk factors listed in Table 2. Together, they explained only 17% of the variation in triglycerides and 28% of that in HDL-C. When combined with the lipolysis measures, the influence rose to 29% and 36%, respectively. Thus, the impact of subcutaneous adipocyte lipolysis on plasma lipid levels can be regarded as physiologically relevant.
Fat cell lipolysis is subjected to regional variations as reviewed.28,29 The lipolytic activity is higher in visceral than the presently examined subcutaneous depot. However, subcutaneous adipose tissue is by far the body’s largest fat depot, and an important mass effect of its lipolytic action is, therefore, likely. This notion is supported by studies of Jensen30 and his colleagues, demonstrating that subcutaneous white adipose tissue is a much more important contributor to hepatic fatty acids than visceral fat. Our present findings on serum FFAs are in line with these results showing that high levels were strongly correlated with a high rate of basal lipolysis in subcutaneous fat cells irrespectively of how basal lipolysis was expressed. It would nevertheless have been interesting to compare the results obtained herein with lipolysis measures in visceral fat cells from the same individuals. Unfortunately, such a study would be difficult to perform. Visceral fat can only be obtained in connection with general surgery, and it would be impossible to standardize patient selection and surgical or anesthetic procedures for a long period of time. In our investigation, we used the same methods that were performed by the same staff throughout the study.
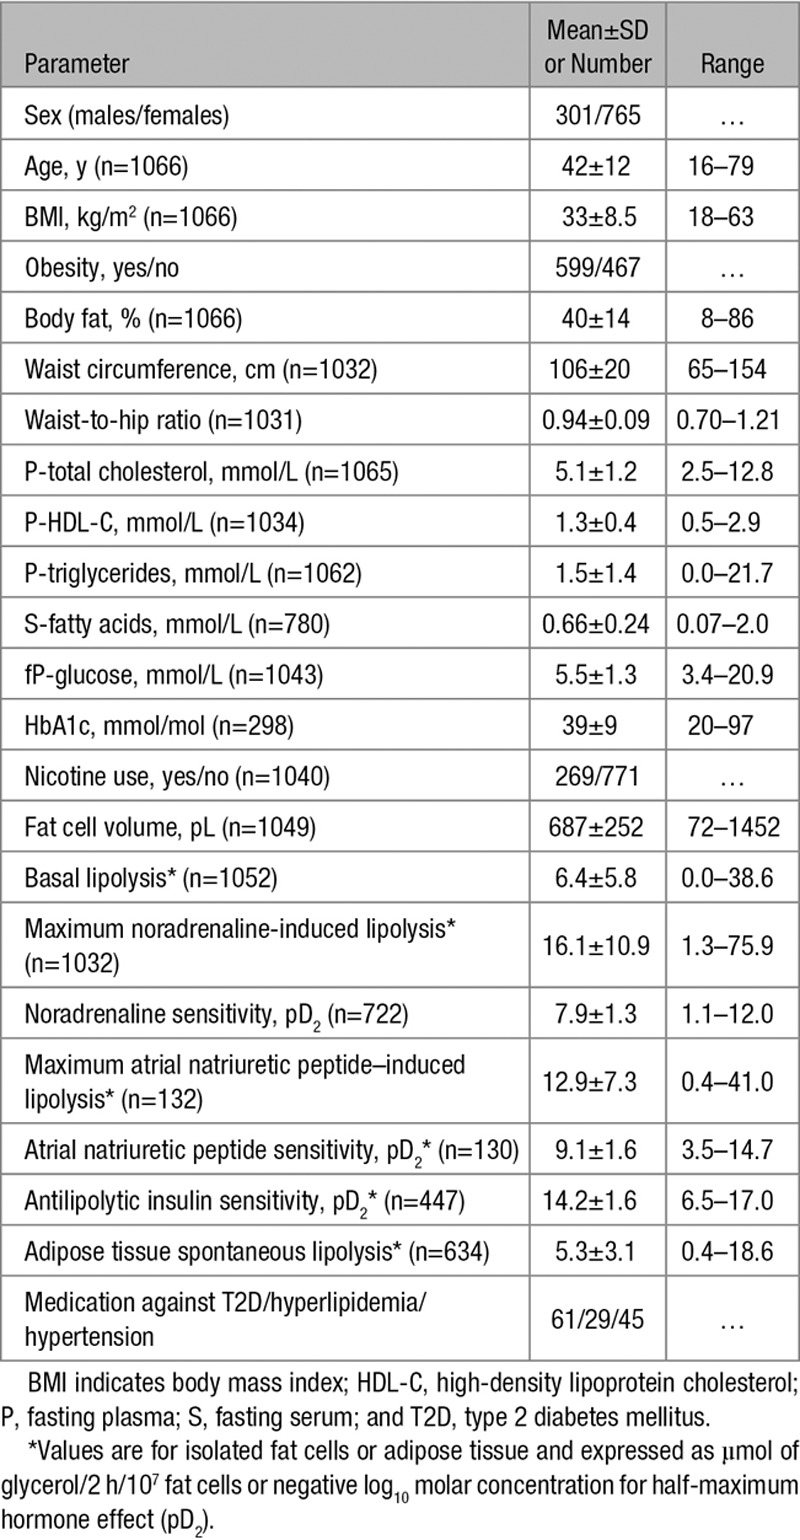
Lipolysis was measured in isolated fat cells, and it might be argued that at least basal lipolysis in this cell preparation does not measure a clinically relevant form of lipolysis. This is, however, unlikely because we observed a strong correlation between the rate of basal lipolysis in isolated fat cells and adipose tissue pieces ex vivo. Furthermore, lipolysis was determined in vitro, which may differ from that observed in vivo. Methods to assess the latter involve cumbersome microdialysis or tracer catheterization methods that are not suitable for the present type of large-scale study. Importantly though, smaller studies have observed similar results when comparing subcutaneous adipose tissue lipolysis in vivo and in vitro.31,32 Finally, we used a pharmacological evaluation of concentration–response curves instead of measuring lipolysis at a particular hormone concentration representative of the circulating level. There are several reasons for this approach. First, hormone levels in blood vary considerably between the resting state and on different challenges. Second, the important concentrations for this study are those at the cellular levels. For noradrenaline, they are unknown but probably much higher than in blood because the hormone is released through nerve endings in adipose tissue. For insulin, the concentration levels are much lower in adipose tissue than in the circulation both in the fasting and fed states.33,34 In any case, the pD2 values for the different hormones (Table 4) suggest that the half-maximum effective concentrations in our experiments were within the physiological range.
Table 4.
Cohort Characteristics
The inherent epidemiological design of this study does not allow firm conclusions on how lipolysis contributes to dyslipidemia at the molecular level. Nevertheless, some mechanistic explanations can be hypothesized. It is obvious that variations in specific lipolysis-regulating factors are differentially linked to HDL-C/triglycerides. These involve changes independent of regulating hormone receptors (basal lipolysis) or events at or near the insulin receptor (insulin pD2). In contrast, hormone-stimulated lipolysis (mediated either by noradrenaline or atrial natriuretic peptide) seems to be of less importance. This suggests that increased lipolysis in the resting (basal) and postprandial (insulin-mediated inhibition) states are more relevant in explaining variations in circulating lipid levels than lipolysis induced by physical activity or mental stress (ie, catecholamines). As discussed above, increased lipolysis and FFAs can affect dyslipidemia through direct effects on hepatic very-low-density lipoprotein assembly and secretion.8–11 However, indirect effects may also play a role, for instance, FFA-mediated insulin resistance35 and altered cholesteryl ester transfer protein activity.36
In summary, this study suggests that lipolysis in subcutaneous fat cells is an important and independent contributor to variations in plasma triglycerides and HDL-C levels. This relationship pertains specifically to spontaneous (basal) and insulin-inhibited lipolysis.
Acknowledgments
The skillful assistance of research nurses Britt-Marie Leijonhufvud, Katarina Hertel, and Yvonne Widlund, as well as of laboratory technicians Eva Sjölin, Kerstin Wåhlén, and Elisabeth Dungner is gratefully acknowledged.
Sources of Funding
This study was supported by grants from the Swedish Research Council, Novo Nordisk Foundation including the Tripartite Immuno-metabolism Consortium (TrIC) Grant Number NNF15CC0018486 and the MSAM consortium NNF15SA0018346, CIMED, Swedish Diabetes Foundation, European Federation for the Study of Diabetes (EFSD), Stockholm County Council, and the Diabetes Research Program at Karolinska Institutet.
Disclosures
None.
Supplementary Material
Nonstandard Abbreviations and Acronyms
- FFAs
- free fatty acids
- HDL-C
- high-density lipoprotein cholesterol
The online-only Data Supplement is available with this article at http://atvb.ahajournals.org/lookup/suppl/doi:10.1161/ATVBAHA.117.309759/-/DC1.
References
- 1.Nelson RH. Hyperlipidemia as a risk factor for cardiovascular disease. Prim Care. 2013;40:195–211. doi: 10.1016/j.pop.2012.11.003. doi: 10.1016/j.pop.2012.11.003. [DOI] [PMC free article] [PubMed] [Google Scholar]
- 2.Nordestgaard BG. Triglyceride-rich lipoproteins and atherosclerotic cardiovascular disease: new insights from epidemiology, genetics, and biology. Circ Res. 2016;118:547–563. doi: 10.1161/CIRCRESAHA.115.306249. doi: 10.1161/CIRCRESAHA.115.306249. [DOI] [PubMed] [Google Scholar]
- 3.Klop B, Elte JW, Cabezas MC. Dyslipidemia in obesity: mechanisms and potential targets. Nutrients. 2013;5:1218–1240. doi: 10.3390/nu5041218. doi: 10.3390/nu5041218. [DOI] [PMC free article] [PubMed] [Google Scholar]
- 4.Cole CB, Nikpay M, McPherson R. Gene-environment interaction in dyslipidemia. Curr Opin Lipidol. 2015;26:133–138. doi: 10.1097/MOL.0000000000000160. doi: 10.1097/MOL.0000000000000160. [DOI] [PubMed] [Google Scholar]
- 5.Ramasamy I. Update on the molecular biology of dyslipidemias. Clin Chim Acta. 2016;454:143–185. doi: 10.1016/j.cca.2015.10.033. doi: 10.1016/j.cca.2015.10.033. [DOI] [PubMed] [Google Scholar]
- 6.Dake AW, Sora ND. Diabetic dyslipidemia review: an update on current concepts and management guidelines of diabetic dyslipidemia. Am J Med Sci. 2016;351:361–365. doi: 10.1016/j.amjms.2016.01.020. doi: 10.1016/j.amjms.2016.01.020. [DOI] [PubMed] [Google Scholar]
- 7.Havel RJ, Kane JP, Balasse EO, Segel N, Basso LV. Splanchnic metabolism of free fatty acids and production of triglycerides of very low density lipoproteins in normotriglyceridemic and hypertriglyceridemic humans. J Clin Invest. 1970;49:2017–2035. doi: 10.1172/JCI106422. doi: 10.1172/JCI106422. [DOI] [PMC free article] [PubMed] [Google Scholar]
- 8.Ebbert JO, Jensen MD. Fat depots, free fatty acids, and dyslipidemia. Nutrients. 2013;5:498–508. doi: 10.3390/nu5020498. doi: 10.3390/nu5020498. [DOI] [PMC free article] [PubMed] [Google Scholar]
- 9.Lewis GF. Fatty acid regulation of very low density lipoprotein production. Curr Opin Lipidol. 1997;8:146–153. doi: 10.1097/00041433-199706000-00004. [DOI] [PubMed] [Google Scholar]
- 10.Duez H, Lamarche B, Valéro R, Pavlic M, Proctor S, Xiao C, Szeto L, Patterson BW, Lewis GF. Both intestinal and hepatic lipoprotein production are stimulated by an acute elevation of plasma free fatty acids in humans. Circulation. 2008;117:2369–2376. doi: 10.1161/CIRCULATIONAHA.107.739888. doi: 10.1161/CIRCULATIONAHA.107.739888. [DOI] [PMC free article] [PubMed] [Google Scholar]
- 11.Carpentier AC, Bourbonnais A, Frisch F, Giacca A, Lewis GF. Plasma nonesterified fatty acid intolerance and hyperglycemia are associated with intravenous lipid-induced impairment of insulin sensitivity and disposition index. J Clin Endocrinol Metab. 2010;95:1256–1264. doi: 10.1210/jc.2009-1932. doi: 10.1210/jc.2009-1932. [DOI] [PubMed] [Google Scholar]
- 12.Rashid S, Uffelman KD, Lewis GF. The mechanism of HDL lowering in hypertriglyceridemic, insulin-resistant states. J Diabetes Complications. 2002;16:24–28. doi: 10.1016/s1056-8727(01)00191-x. [DOI] [PubMed] [Google Scholar]
- 13.Kissebah AH, Adams PW, Wynn V. Plasma free fatty acid and triglyceride transport kinetics in man. Clin Sci Mol Med. 1974;47:259–278. doi: 10.1042/cs0470259. [DOI] [PubMed] [Google Scholar]
- 14.Carr MC, Hokanson JE, Zambon A, Deeb SS, Barrett PH, Purnell JQ, Brunzell JD. The contribution of intraabdominal fat to gender differences in hepatic lipase activity and low/high density lipoprotein heterogeneity. J Clin Endocrinol Metab. 2001;86:2831–2837. doi: 10.1210/jcem.86.6.7586. doi: 10.1210/jcem.86.6.7586. [DOI] [PubMed] [Google Scholar]
- 15.Guendouzi K, Jaspard B, Barbaras R, Motta C, Vieu C, Marcel Y, Chap H, Perret B, Collet X. Biochemical and physical properties of remnant-HDL2 and of pre beta 1-HDL produced by hepatic lipase. Biochemistry. 1999;38:2762–2768. doi: 10.1021/bi9815086. doi: 10.1021/bi9815086. [DOI] [PubMed] [Google Scholar]
- 16.Arner P, Bernard S, Salehpour M, Possnert G, Liebl J, Steier P, Buchholz BA, Eriksson M, Arner E, Hauner H, Skurk T, Rydén M, Frayn KN, Spalding KL. Dynamics of human adipose lipid turnover in health and metabolic disease. Nature. 2011;478:110–113. doi: 10.1038/nature10426. doi: 10.1038/nature10426. [DOI] [PMC free article] [PubMed] [Google Scholar]
- 17.Frayn K, Bernard S, Spalding K, Arner P. Adipocyte triglyceride turnover is independently associated with atherogenic dyslipidemia. J Am Heart Assoc. 2012;1:e003467. doi: 10.1161/JAHA.112.003467. doi: 10.1161/JAHA.112.003467. [DOI] [PMC free article] [PubMed] [Google Scholar]
- 18.Langin D. Adipose tissue lipolysis as a metabolic pathway to define pharmacological strategies against obesity and the metabolic syndrome. Pharmacol Res. 2006;53:482–491. doi: 10.1016/j.phrs.2006.03.009. doi: 10.1016/j.phrs.2006.03.009. [DOI] [PubMed] [Google Scholar]
- 19.Arner P, Langin D. Lipolysis in lipid turnover, cancer cachexia, and obesity-induced insulin resistance. Trends Endocrinol Metab. 2014;25:255–262. doi: 10.1016/j.tem.2014.03.002. doi: 10.1016/j.tem.2014.03.002. [DOI] [PubMed] [Google Scholar]
- 20.Rydén M, Arner P. Tumour necrosis factor-alpha in human adipose tissue – from signalling mechanisms to clinical implications. J Intern Med. 2007;262:431–438. doi: 10.1111/j.1365-2796.2007.01854.x. doi: 10.1111/j.1365-2796.2007.01854.x. [DOI] [PubMed] [Google Scholar]
- 21.Larsson B, Björntorp P, Holm J, Scherstén T, Sjöström L, Smith U. Adipocyte metabolism in endogenous hypertriglyceridemia. Metabolism. 1975;24:1375–1389. doi: 10.1016/0026-0495(75)90053-0. [DOI] [PubMed] [Google Scholar]
- 22.Kissebah AH, Alfarsi S, Adams PW, Wynn V. Role of insulin resistance in adipose tissue and liver in the pathogenesis of endogenous hypertriglyceridaemia in man. Diabetologia. 1976;12:563–571. doi: 10.1007/BF01220632. [DOI] [PubMed] [Google Scholar]
- 23.Arner P, Engfeldt P, Ostman J. Changes in the metabolism of fatty acids in adipose tissue in obese patients with primary hypertriacylglycerolemia. J Lipid Res. 1982;23:422–427. [PubMed] [Google Scholar]
- 24.Yki-Järvinen H, Taskinen MR. Interrelationships among insulin’s antilipolytic and glucoregulatory effects and plasma triglycerides in nondiabetic and diabetic patients with endogenous hypertriglyceridemia. Diabetes. 1988;37:1271–1278. doi: 10.2337/diab.37.9.1271. [DOI] [PubMed] [Google Scholar]
- 25.Reynisdottir S, Eriksson M, Angelin B, Arner P. Impaired activation of adipocyte lipolysis in familial combined hyperlipidemia. J Clin Invest. 1995;95:2161–2169. doi: 10.1172/JCI117905. doi: 10.1172/JCI117905. [DOI] [PMC free article] [PubMed] [Google Scholar]
- 26.van der Kallen CJ, Voors-Pette C, Bouwman FG, Keizer HA, Lu JY, van de Hulst RR, Bianchi R, Janssen MJ, Keulen ET, Boeckx WD, Rotter JI, de Bruin TW. Evidence of insulin resistant lipid metabolism in adipose tissue in familial combined hyperlipidemia, but not type 2 diabetes mellitus. Atherosclerosis. 2002;164:337–346. doi: 10.1016/s0021-9150(02)00109-0. [DOI] [PubMed] [Google Scholar]
- 27.Lönnqvist F, Thörne A, Large V, Arner P. Sex differences in visceral fat lipolysis and metabolic complications of obesity. Arterioscler Thromb Vasc Biol. 1997;17:1472–1480. doi: 10.1161/01.atv.17.7.1472. [DOI] [PubMed] [Google Scholar]
- 28.Lafontan M, Girard J. Impact of visceral adipose tissue on liver metabolism. Part I: heterogeneity of adipose tissue and functional properties of visceral adipose tissue. Diabetes Metab. 2008;34(4)(pt 1):317–327. doi: 10.1016/j.diabet.2008.04.001. doi: 10.1016/j.diabet.2008.04.001. [DOI] [PubMed] [Google Scholar]
- 29.Lee MJ, Wu Y, Fried SK. Adipose tissue heterogeneity: implication of depot differences in adipose tissue for obesity complications. Mol Aspects Med. 2013;34:1–11. doi: 10.1016/j.mam.2012.10.001. doi: 10.1016/j.mam.2012.10.001. [DOI] [PMC free article] [PubMed] [Google Scholar]
- 30.Jensen MD. Role of body fat distribution and the metabolic complications of obesity. J Clin Endocrinol Metab. 2008;93(11)(suppl 1):S57–S63. doi: 10.1210/jc.2008-1585. doi: 10.1210/jc.2008-1585. [DOI] [PMC free article] [PubMed] [Google Scholar]
- 31.Kolehmainen M, Ohisalo JJ, Kaartinen JM, Tuononen V, Pääkkönen M, Poikolainen E, Alhava E, Uusitupa MI. Concordance of in vivo microdialysis and in vitro techniques in the studies of adipose tissue metabolism. Int J Obes Relat Metab Disord. 2000;24:1426–1432. doi: 10.1038/sj.ijo.0801438. [DOI] [PubMed] [Google Scholar]
- 32.Agustsson T, Rydén M, Hoffstedt J, van Harmelen V, Dicker A, Laurencikiene J, Isaksson B, Permert J, Arner P. Mechanism of increased lipolysis in cancer cachexia. Cancer Res. 2007;67:5531–5537. doi: 10.1158/0008-5472.CAN-06-4585. doi: 10.1158/0008-5472.CAN-06-4585. [DOI] [PubMed] [Google Scholar]
- 33.Jansson PA, Fowelin JP, von Schenck HP, Smith UP, Lönnroth PN. Measurement by microdialysis of the insulin concentration in subcutaneous interstitial fluid. Importance of the endothelial barrier for insulin. Diabetes. 1993;42:1469–1473. doi: 10.2337/diab.42.10.1469. [DOI] [PubMed] [Google Scholar]
- 34.Sandqvist M, Strindberg L, Schmelz M, Lönnroth P, Jansson PA. Impaired delivery of insulin to adipose tissue and skeletal muscle in obese women with postprandial hyperglycemia. J Clin Endocrinol Metab. 2011;96:E1320–E1324. doi: 10.1210/jc.2011-0233. doi: 10.1210/jc.2011-0233. [DOI] [PubMed] [Google Scholar]
- 35.Sears B, Perry M. The role of fatty acids in insulin resistance. Lipids Health Dis. 2015;14:121. doi: 10.1186/s12944-015-0123-1. doi: 10.1186/s12944-015-0123-1. [DOI] [PMC free article] [PubMed] [Google Scholar]
- 36.El Harchaoui K, van der Steeg WA, Stroes ES, Kastelein JJ. The role of CETP inhibition in dyslipidemia. Curr Atheroscler Rep. 2007;9:125–133. doi: 10.1007/s11883-007-0008-5. [DOI] [PubMed] [Google Scholar]


